A series of previous posts (found here, here and over here) described how our measurements of the positronium (Ps, an atom formed of an electron and its antimatter counterpart, the positron) 2 3S1 → 2 3PJ fine structure energy intervals were subject to significant shifts due to frequency dependent microwave power [1,2]. This variation in the power was due to reflections of the microwave radiation causing more power at some frequencies that others, skewing our measurements [3,4]. See the previous posts for a description of how we measure line shapes to determine the transition frequency. This post describes a new measurement of the 2 3S1 → 2 3P2 energy interval, known as the ν2 transition, performed using a waveguide with a new experimental design to eliminate reflection effects. The full published version of this work can be found in Reference [5].
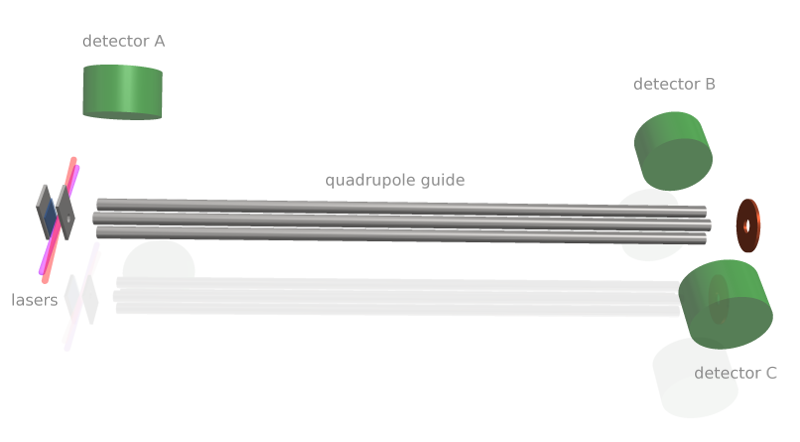
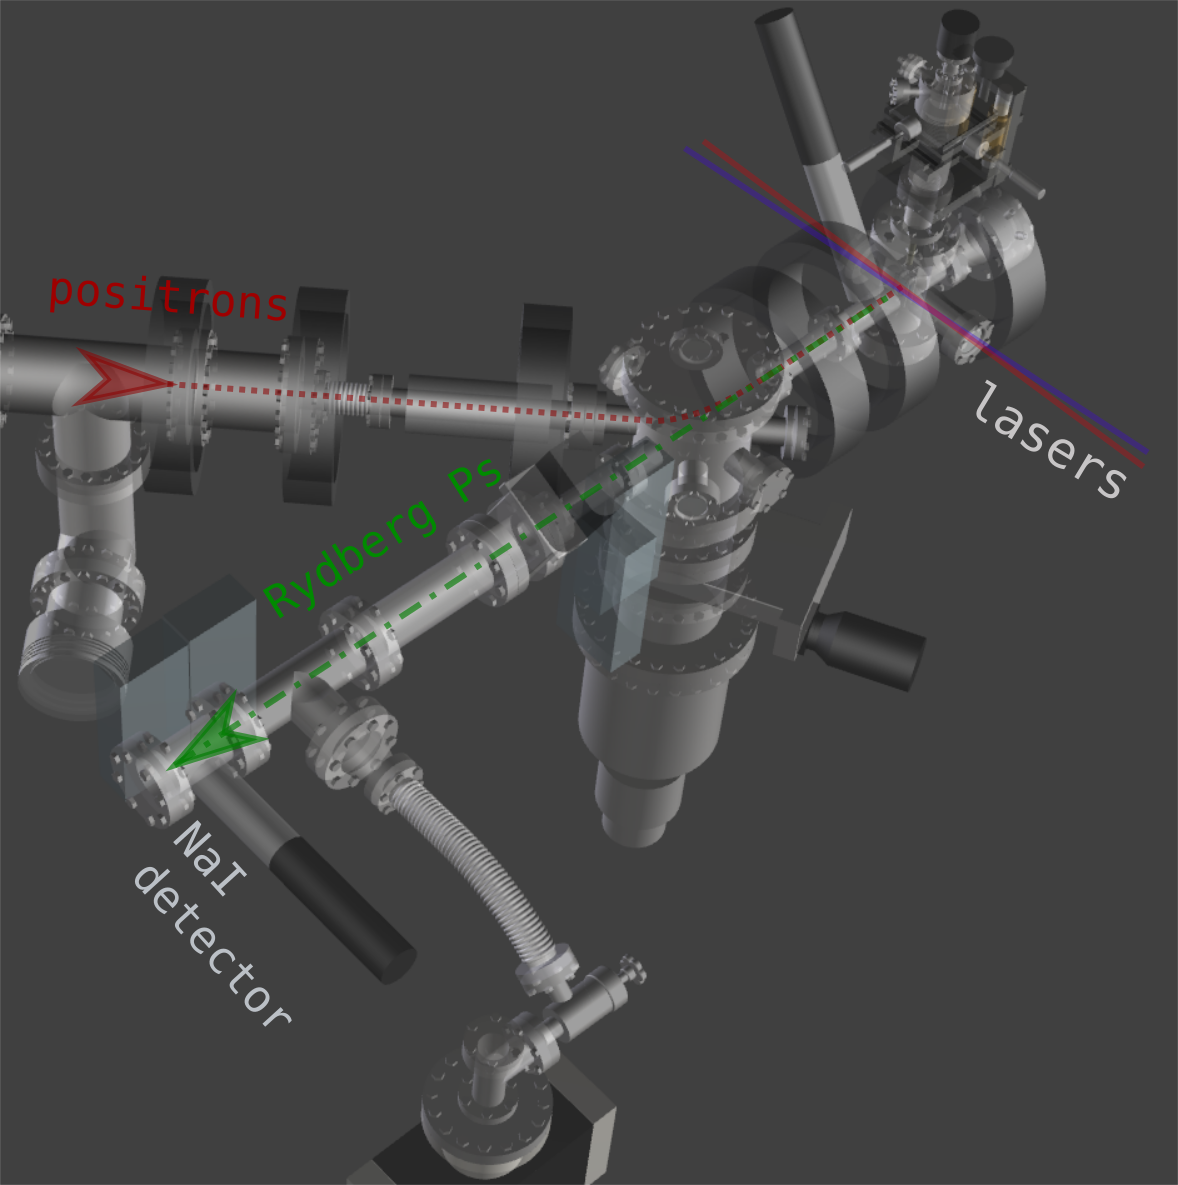
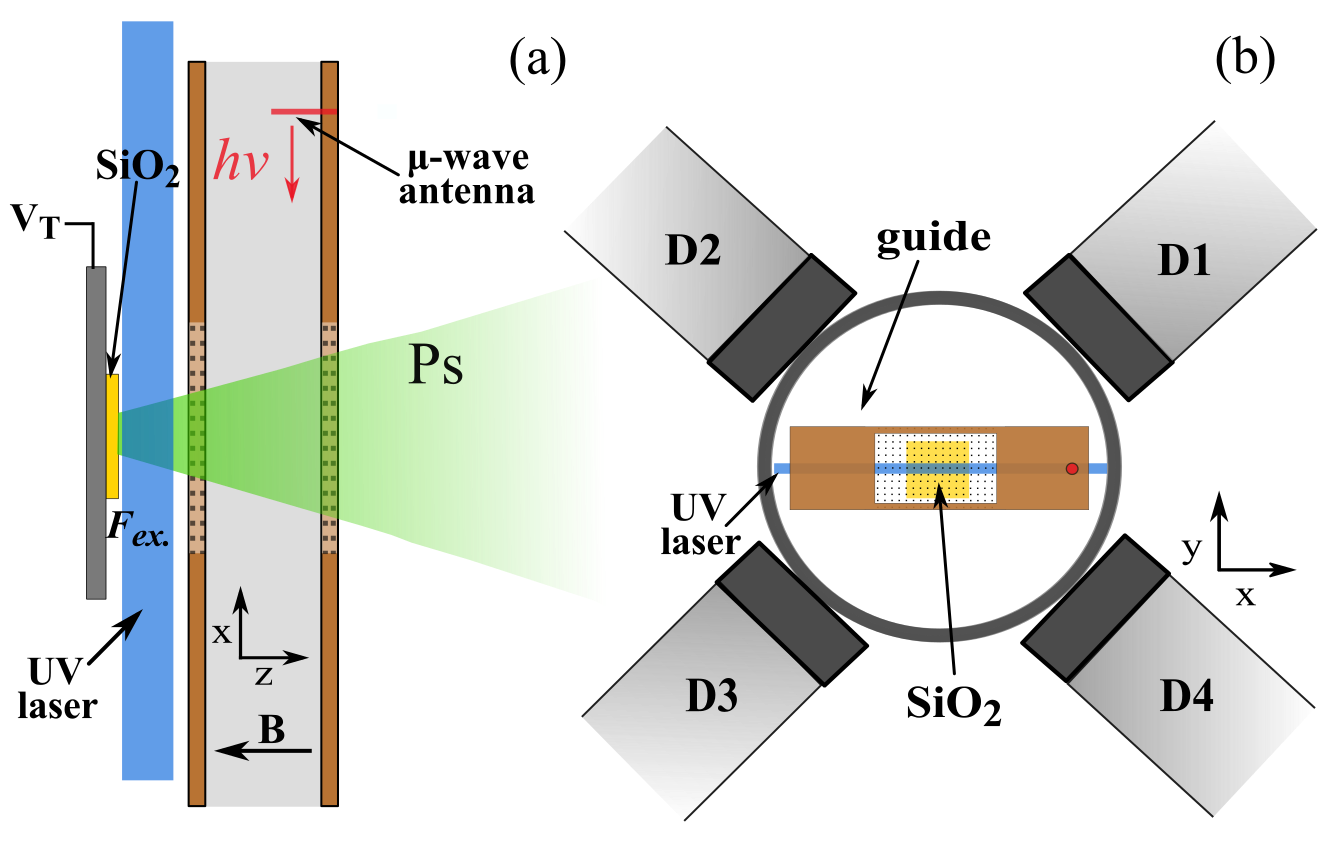
The solution to the reflection problem, as determined from simulations of the microwave fields, was to use a vacuum chamber that minimised the possibility of microwave reflections going back into the waveguide and creating frequency dependent power variation (all our experiments are performed in a vacuum at <0.00000001% of atmospheric pressure to prevent the Ps scattering and annihilating). The vacuum chamber chosen was a cube, see Figure 1 for a diagram of the experimental layout. In this chamber the ends of the waveguide are just a few millimeters from the windows used to let in laser radiation, thus microwaves will pass out of the chamber as fused silica is transparent to microwaves, unlike metal which is highly reflective. This way we reduced the amount of reflected radiation and thus the frequency dependent power variation. Microwave absorbing foam with a reflectivity of <1% was placed on the windows, ensuring no microwaves were reflected back into the waveguide from outside the vacuum chamber.

This experiment also had a few other improvements. Firstly, Doppler effects were minimised by retro-reflection of the UV laser beam used to make the 2 3S1 state Ps. If the laser Doppler selects atoms moving in one direction (away or towards the laser), then the retro-reflected beam, moving in an equal and opposite path, will select out atoms moving in the equal and opposite direction, resulting in a net zero velocity. Secondly, an extra wire mesh EG was included between the Ps production target ET, which has a large bias of -3.5 kV, and the waveguide to minimise electric field penetration into the microwave excitation region. Electric fields induce unwanted Stark shifts to ν2, but are attenuated strongly by wire meshes [6].
The quantum electrodynamic (QED) calculations we wish to test are for the zero-field case, where the atoms are in a region of no electric or magnetic field and do not interact with each other. The atoms in our experiment were a gas with less than 105 atoms per cubed centimeter and the electric fields present were very small. However, our experiment had to take place in a substantial magnetic field because this is how we guide our pulses of positrons to the location where we make Ps. A magnetic field will change the energy of quantum states (i.e. shifting where they lie in the electric potential well of the atom) and thus the energy intervals between states. This is called the Zeeman shift, and it is caused by an applied magnetic field distorting and polarising the probability distribution of the particles [7].
To get around this we measured the transition energy in multiple magnetic fields. The Zeeman shift is quadratic and could be extrapolated back to zero-field to obtain a value to compare with QED calculations. The measured transition energy νR (in MHz) is shown in Figure 2 as a function of magnetic field and the dashed lines are the extrapolations to zero-field. The figure shows data for microwave radiation moving toward the Ps atoms in two opposite directions, +x and –x, propagating in either direction along the waveguide. By taking the average of these two measurements we exactly cancel out any Doppler shifts between Ps and microwaves. However, the maximum Doppler shifts was expected to be ±0.26 MHz, based on the maximum possible misalignment of the Ps, laser and waveguide. This is much smaller than the 1.8 MHz difference observed, which is puzzling.

All other systematic effects are <0.1 MHz, yet the two directions disagree with each other. The prime suspect for this shift, reflection effects, was eliminated with the new chamber design and the foam. This was confirmed as shown in Figure 2 whereby data with foam (hollow points) and without foam (solid points) present does not display any change in the measured transition frequency. However, there was a small asymmetry to our line shape mesurements, which has previously indicated frequency dependent power [2]. This lead us to conclude that there were internal effects from defects in the waveguide construction or microwave circuit which caused frequency dependent power, distorting the line shapes. We treated this effect as a systematic error with a magnitude of 1.8/2 = 0.9 MHz, lowering the precision of our final result.
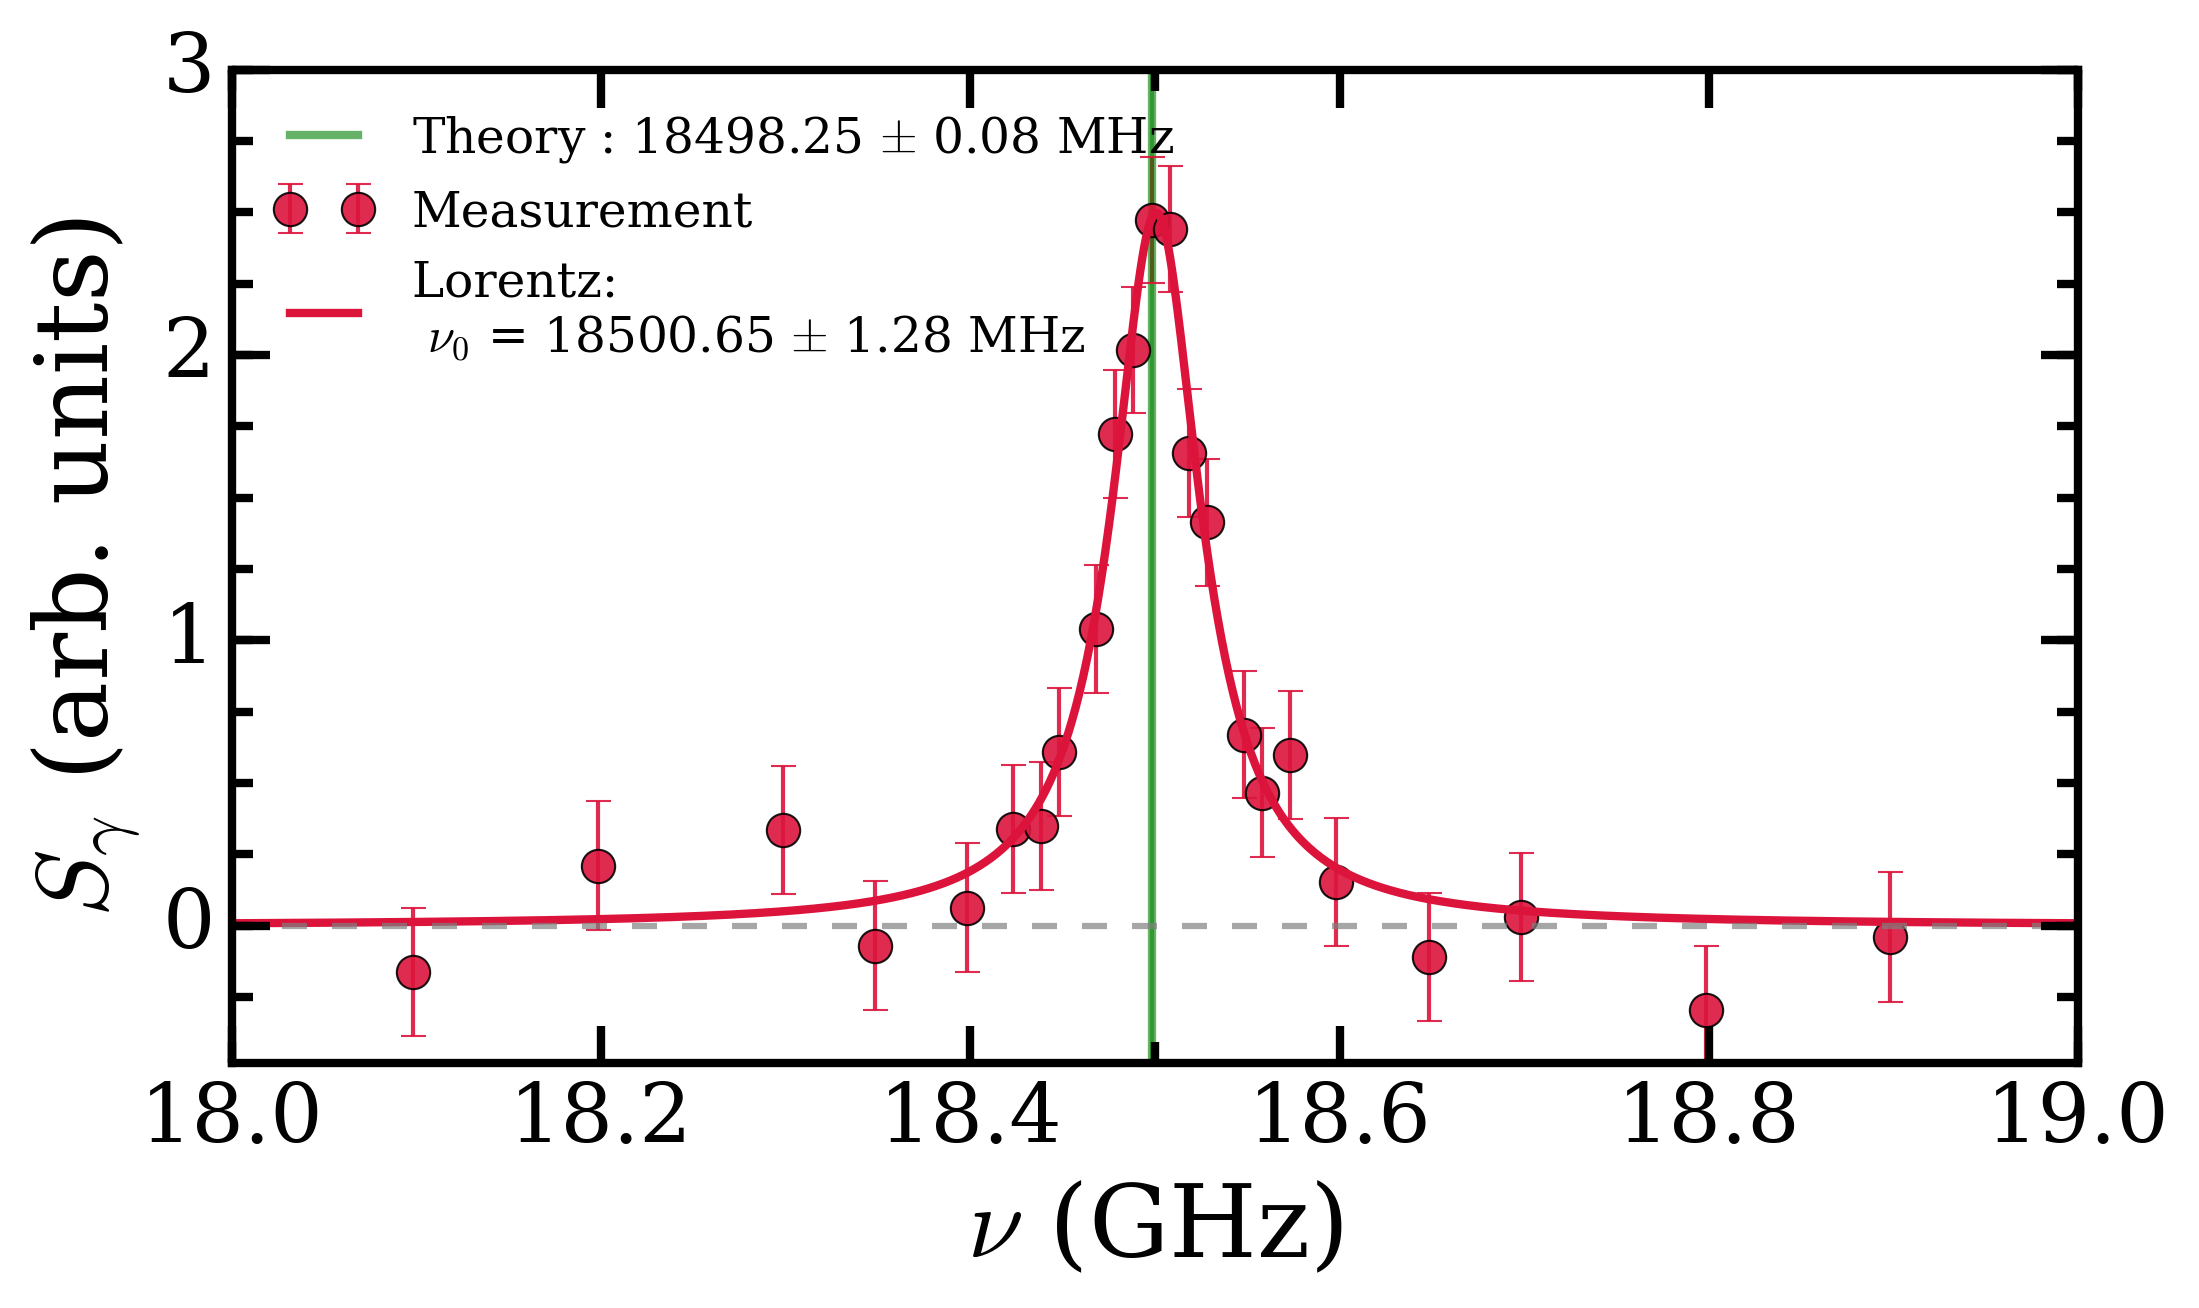
Our final value for the ν2 energy interval was 8627.94 ± 0.95 MHz, close enough to theory to be in broad agreement, as shown in Figure 3. This new value is the most precise measurement to date but fails to test the latest set of QED calculations, which can be described by a summation of smaller and smaller terms (i.e. ν2 = O4 + O5 + O6 + O7 + …). A measurement with just a ten times improvement in precision will be able to do this, and a 10000 times improvement would allow us to to test certain dark matter candidates [2]. We believe that this method has inherent vulnerabilities to frequency dependent microwave power and that other methods should be explored, a post on this will be coming soon. However, with improvements to the waveguide design and microwave circuit this methodology can be used for precision measurements nonetheless.

[1] Precision Microwave Spectroscopy of the Positronium n = 2 Fine Structure. L. Gurung, T. J. Babij, S. D. Hogan and D. B. Cassidy; Phys. Rev. Lett.125, 073002 (2020)
[2] Observation of asymmetric line shapes in precision microwave spectroscopy of the positronium 23P1 →23PJ (J = 1, 2) fine-structure intervals. L. Gurung, T. J. Babij, J. Pérez-Ríos, S. D. Hogan and D. B. Cassidy; Phys. Rev. A.103, 042805 (2021)
[3] Line-shape modelling in microwave spectroscopy of the positronium n = 2 fine-structure intervals. L. A. Akopyan, T. J. Babij, K. Lakhmanskiy, D. B. Cassidy and A. Matveev; Phys. Rev. A. 104, 062810 (2021)
[4] Microwave spectroscopy of positronium atoms in free space. R. E. Sheldon, T. J. Babij, S. H. Reeder, S. D. Hogan, and D. B. Cassidy; Phys. Rev. A 107, 042810 (2023)
[5] Precision microwave spectroscopy of the positronium 2 3S1 →2 3P2 interval. R. E. Sheldon, T. J. Babij, S. H. Reeder, S. D. Hogan, and D. B. Cassidy; Phys. Rev. Lett. 131, 043001 (2023)
[6] Penetration of electrostatic fields and potentials through meshes, grids, or gauzes. F. H. Read, N. J. Bowring, P. D. Bullivant, and R. R. A. Ward; Rev. Sci. Instruments, 69 (5), 2000–2006 (1998)
[7] Atomic physics. C. J. Foot; Oxford master series in physics, Oxford University Press (2005)


 23P0 transition, known as the
  interval, named after the subscript of the final state. These numbers and letters symbolise the values of different quantum numbers and therefore uniquely describe the energy state of the Ps atom. The image below explains what these numbers and letters represent.
 and
and  , see the published data

 23PJ (J = 1, 2) fine-structure intervals. L. Gurung, T. J. Babij, J. Pérez-Ríos, S. D. Hogan and D. B. Cassidy, Phys. Rev. A.103, 042805 (2021)
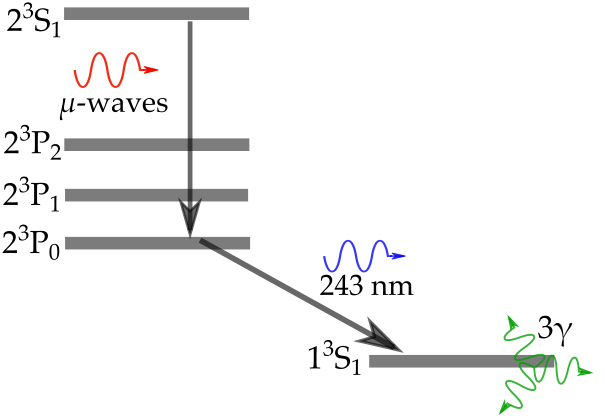


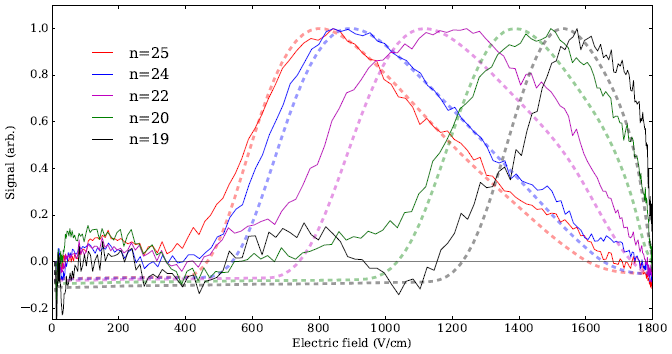


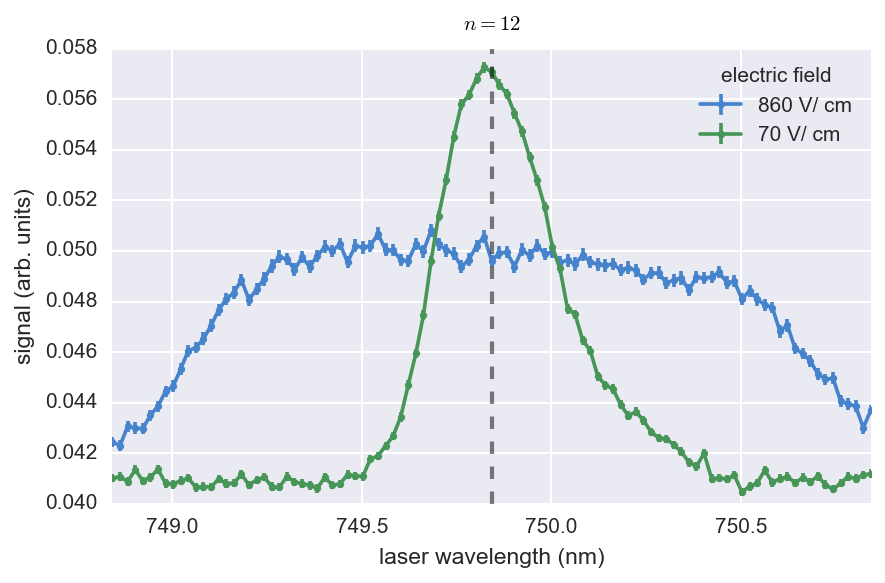
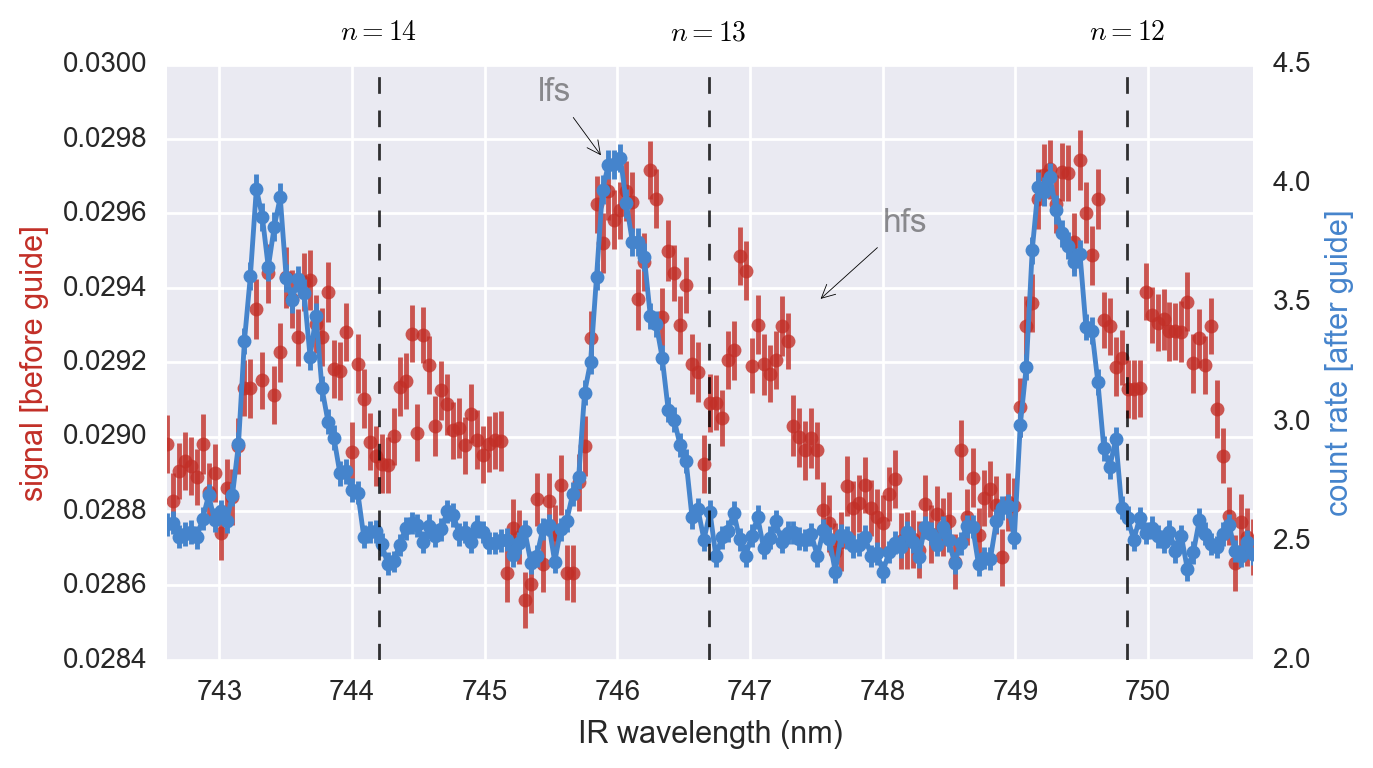
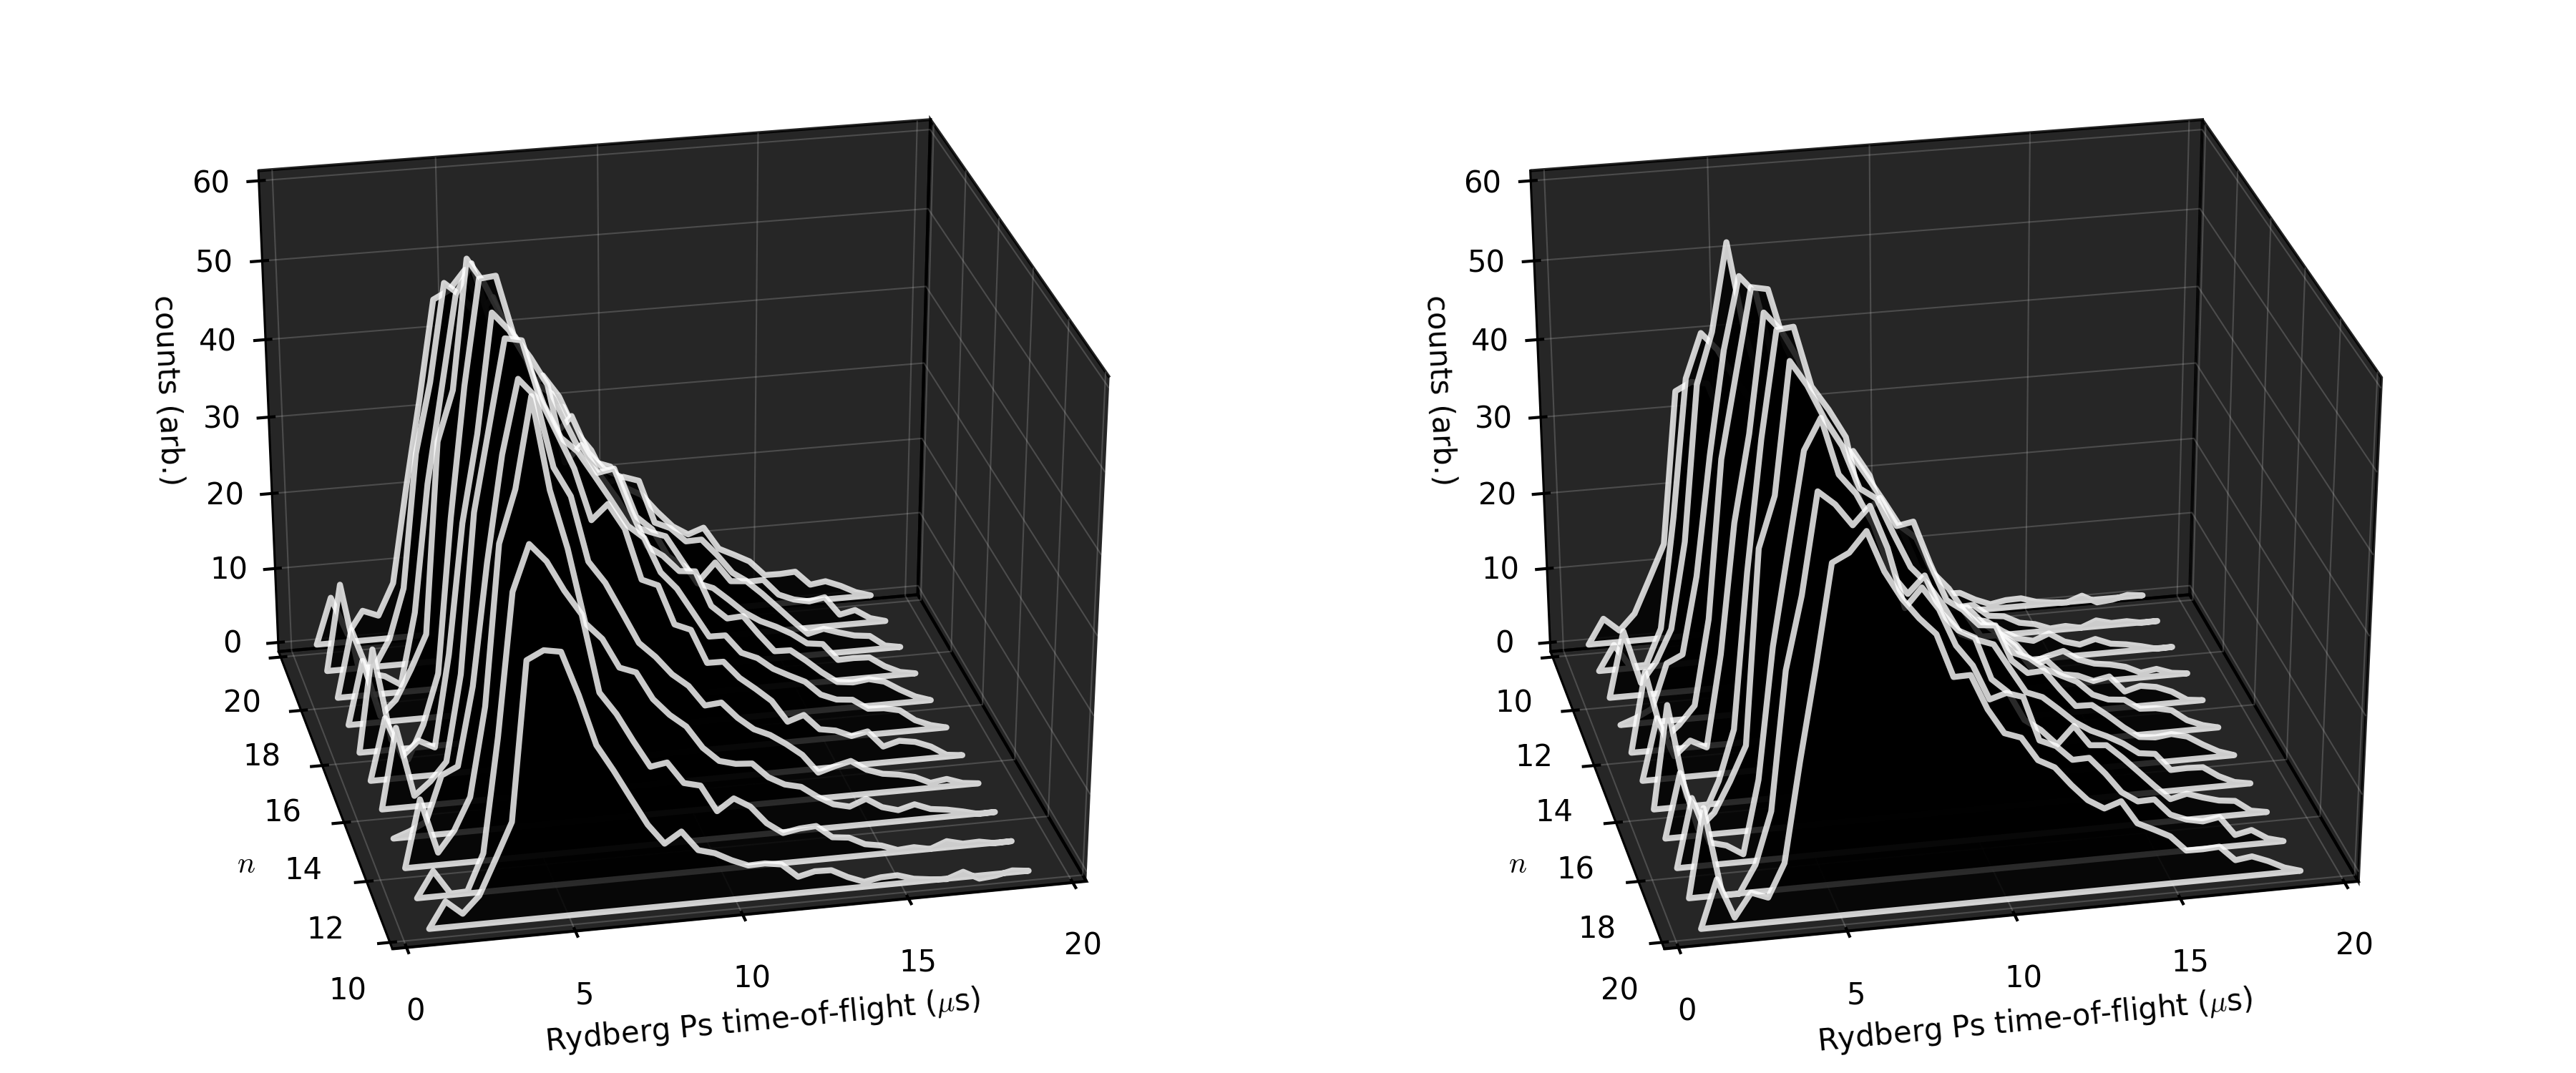
 However, in this case it is clear that only the n = 19 state benefited from having the “switch on”, indicating that is the smallest-n state that this scheme is necessary for our current electric-field configuration.
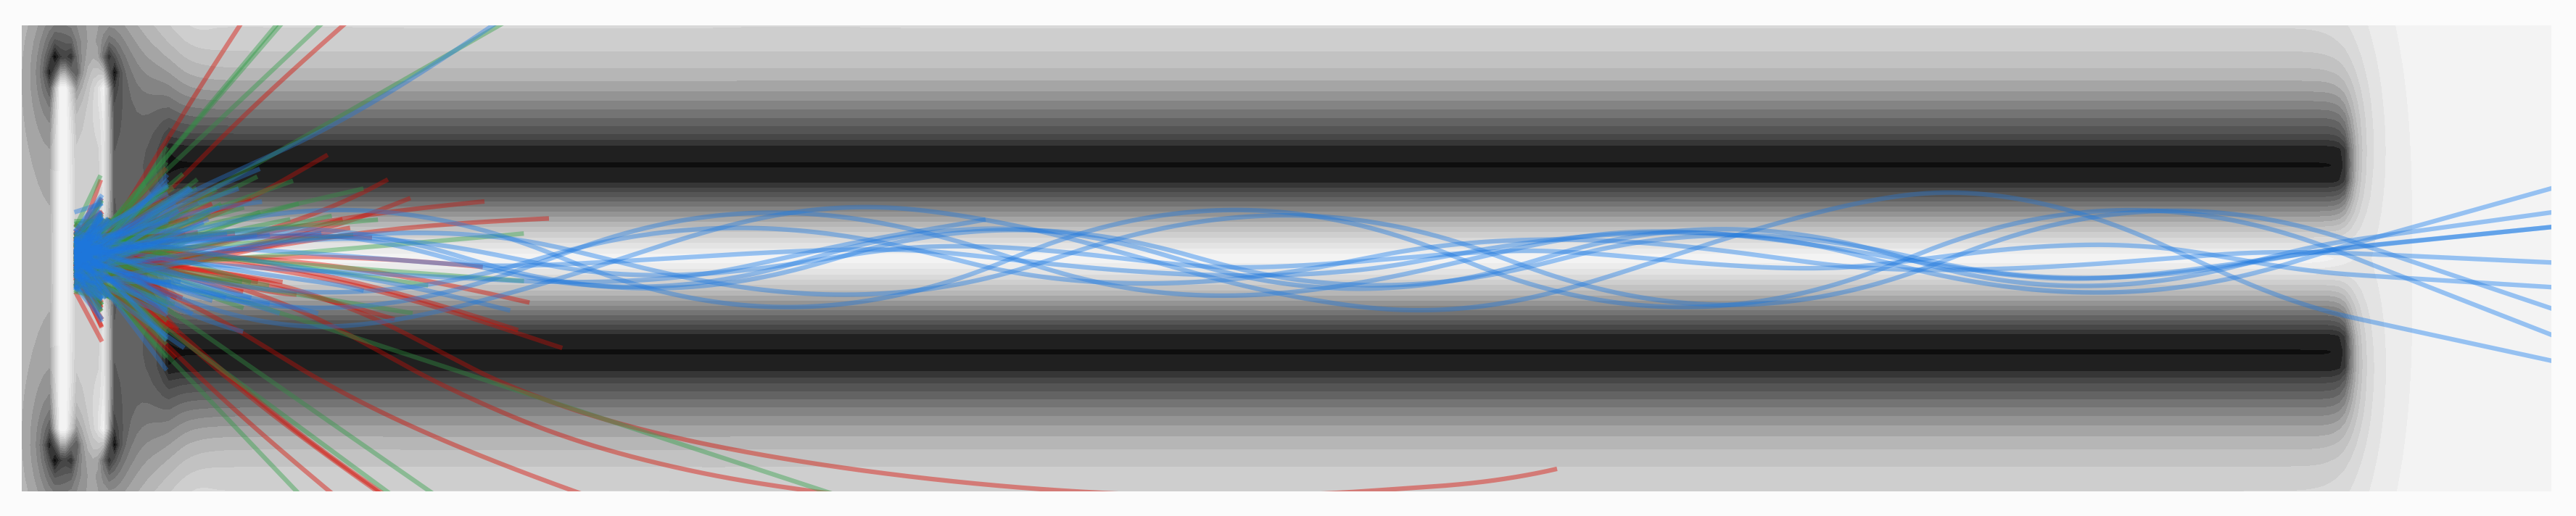
 = 0. If the Ps atoms are then allowed to travel (adiabatically) to a region of zero nominal electric field (our experimental set-up [