Precision microwave spectroscopy of Ps

Positronium is an atom which is half-matter and half-antimatter. Its energy structure is very well defined by the theory of quantum electrodynamics (QED) [1]. QED essentially describes how photons (light particles) and matter interact. If you imagine an electron in the vicinity of another electron, the classical picture says that the electric field of one electron exerts a repulsive force on the other electron, and vice versa. In the QED picture the two electrons interact by exchanging photons. Beyond electrons, the protons and neutrons in a nucleus are held together by the Strong force via the exchange of another type of particle called gluons.

The aim of precision spectroscopy is to carry out new measurements that will be compared to theoretical calculations. Measuring these energy structure provide a way of verifying the predictions made by theory. Atomic systems like hydrogen and helium are widely studied for QED testing, but the presence of heavy hadrons like protons introduces complications. One does not need to worry about such complications in positronium as there are no hadrons involved.

Within positronium there are many energy levels one could choose to measure. The separation of the triplet and singlet states of the n=1 level (i.e., the hyperfine structure interval), the 1S-2S interval, and the 2S-2P intervals are all excellent candidates [2]. The theoretical calculations for these three intervals have been very precisely calculated, and have also been previously measured. The last measurement of the fine structure intervals [3], however, is now over 25 years old and is much less precise than theory. Because Ps is very well defined by QED theory, any disagreements between calculations and measurements could be an indication of new physics. To be sensitive to new physics, the experiments have to done with precision comparable to calculations.

Interference
Figure 1: The Ps n=2 fine structure.

Recently we have measured the 2S-2P fine structure intervals of positronium [4]. There are three transitions within this branch and in this post, we’ll talk about the ν0 transition (23S1 – 23P0) which is resonant around 18 GHz. This transition, including the other two, is illustrated in figure 1. Initially, the Ps atoms (which are formed in the 1S state) have to be excited to the 2S state. This can be done in several ways (direct 1S-2S transition with one photon is not allowed), and we will cover our method in detail in another blog post soon. For now, let’s assume that the atoms are already in the 2S state. These atoms then fly into a waveguide where the microwaves drive them to the 2P state (via stimulated emission) as shown in figure 2. The atom then emits a 243 nm photon and drops down to the 1S state, where it will annihilate into gamma-rays after 142 ns (remember the lifetime of Ps in the ground state?). If nothing happens in the waveguide, the 23S1 state atom will annihilate after 1 μs.

BlogSchematic
Figure 2: (a) Target, laser, and waveguide schematic. (b) Placement of detectors, D1-D4, around the chamber.

We placed gamma-ray detectors (D1-D4) around the target chamber, as shown in figure 2, to monitor the annihilation signal. The detector signal was then used to quantify the microwave radiation induced signal, Sγ. We scanned over a frequency range to generate a lineshape that describes the transition; the centre describes the resonance frequency and the width is due to the lifetime of the excited state. A Lorentzian function was fitted to extract this information and for the example shown in figure 3, the centroid and line width are 18500.65 MHz and 60 MHz respectively. The centroid is slightly off from theory because the lineshape was measured in a magnetic field which introduces Zeeman shift to the centroid. The measured width is 60 MHz, slightly wider than the expected 50 MHz, and is due to the time taken to travel through the waveguide.

23P0LineshapeBlog
Figure 3: Measured 23S1 – 23P0 transition lineshape with theoretical resonance frequency of 18498.25 MHz.

Similar lineshapes were measured over a range of magnetic fields in order to account for the Zeeman shift. These data are shown in figure 4. Extrapolating to zero with a quadratic function allows us to obtain the field free resonance frequency, free of Zeeman shifts. However, all of the measured points, including the extrapolated number, are offset from theoretical calculation (dashed curve) by about 3 MHz. There are a few systematic effects to consider and the largest of them is the Doppler shift arising from the laser and waveguide misalignment, which amounts to 215 kHz. Our result, compared with theory and previous measurements, is shown in figure 5 and disagrees with theory by 2.77 MHz (4.5 standard deviations). While the precision has improved by over a factor of 6, the disagreement with theory is significant.

Precision measurements can be vulnerable to interference effects and there are two main types of effects that can cause lineshape distortion and/or shifts in line centre. Whenever the radiation emitted from the excited state (2P state in our case) is monitored to generate the signal, the emitted radiation can interfere with the incident/driving radiation (microwaves in our case)[5]. This leads to shift in the resonance frequency, but we are not sensitive to this kind of effect as we monitor the gamma-rays instead of the 243 nm emitted radiation (figure 1). Another type of interference arises from the presence of neighbouring resonance states [6], such as the two other 2P states in the Ps fine structure. The further apart the states are, the lesser the interference effect is and we expect a shift of 200 kHz in our line shape. This is, however, over 10 times smaller than the observed shift, and therefore, cannot be the reason for the disagreement.

There are two more transitions in the fine structure we have measured and they reveal interesting new features which were not previously seen. These additional data will provide a broader picture that will help us explain the shift we see in this transition. We’ll discuss those results in the next blog post.


[1] Karshenboim, S.G., Precision Study of Positronium: Testing Bound State QED Theory. Int. J. Mod. Phys. A, 19 (2004)

[2] Rich, A., Recent Experimental Advances in Positronium Research. Rev. Mod. Phys., 53 (1981)

[3] Hagena, D., Ley, R., Weil, D., Werth, G., Arnold, W. and Schneider, H., Precise Measurement of n=2 Positronium Fine-Structure Intervals. Phys. Rev. Lett., 71 (1993)

[4] Gurung, L., Babij, T. J., Hogan, S. D. and Cassidy, D. B., Precision Microwave Spectroscopy of the n=2 Positronium Fine Structure . Phys. Rev. Lett., 125 (2020)

[5] Beyer, A., Maisenbacher, L., Matveev, A., Pohl, R., Khabarova, K., Grinin, A., Lamour, T., Yost, D.C., Ha ̈nsch, T.W., Kolachevsky, N. and Udem, T., The Rydberg Constant and Proton Size From Atomic Hydrogen. Science, 358 (2017)

[6] Horbatsch, M. and Hessels, E.A., Shifts From a Distant Neighboring Resonance. Phys. Rev. A, 82 (2010)

State-selective field ionization of Rydberg positronium

All atomic systems, including positronium (Ps) can be excited to states with high principal quantum number n using lasers, these are called Rydberg states. Atoms in such states exhibit interesting features that can be exploited in a variety of ways. For example, Rydberg states have very long radiative lifetimes (on the order of 10 µfor our experiments). This is a particularly useful feature in Ps because when it is excited to large-n states, the overlap between the electron and positron wavefunction is suppressed. Therefore the self-annihilation lifetime becomes so large in comparison to the fluorescence lifetime, that the effective lifetime of Ps in a Rydberg state becomes the radiative lifetime of the Rydberg state. Most Rydberg Ps atom will decay back to the ground state first, before self-annihilating [Phys. Rev. A 93, 062513 (2016)]. The large distance between the positron and electron centers of charge in certain Rydberg states also means that they exhibit large static electric dipole moments, and thus their motion can be manipulated by applying forces with inhomogeneous electric fields [Phys. Rev. Lett. 117, 073202 (2016), Phys. Rev. A 95, 053409 (2017)]

In addition to these properties, Rydberg atoms have high tunnel ionization rates at relatively low electric fields. This property forms the basis for state-selective detection by electric field ionization. In a recent series of experiments, we have demonstrated state-selective field ionization of positronium atoms in Rydberg states (n = 18- 25) in both static and time-varying (pulsed) electric fields.

The set-up for this experiment is shown below where the target (T) holds a SiO2 film that produces Ps when positrons are implanted onto it. The first grid (G1) allows us to control the electric field in the laser excitation region, and a second Grid (G2) with a varying voltage provides a well defined ionization region. An electric field is applied by either applying a constant voltage to Grid 2 as in the case of the static field configuration, or by ramping a potential on Grid 2 as in the case of the pulsed field configuration.

Figure 1: Experimental arrangement showing separated laser excitation and field ionization regions.

In this experiment we detect the annihilation gamma rays from:

  • the direct annihilation of positronium

  • annihilations that occur when positronium crashes into the grids and chamber walls

  • annihilations that occur after the positron, released via the tunnel ionization process, crashes into the grids or chamber walls

We subtract the time-dependent gamma ray signal when ground state Ps traverses the apparatus from the signal detected from Rydberg atoms when an electric field is applied in the ionizing region. This forms a background subtracted signal that tells us where in time there is an excess or lack of annihilation radiation occurring when compared to background (this SSPALS method is described further in NIM. A  828, 163 (2016)  and and here).


Static Electric Field Configuration

In this version of the experiment, we let the excited positronium atoms fly into the ionization region where they experience a constant electric field. In the case where a small electric field (~ 0 kV/cm) is applied in the ionizing region, the excited atoms fly unimpeded through the chamber as shown in the animation below. Consequently, the background subtracted spectrum is identical to what we expect for a typical Rydberg signal (see the Figure below for n=20). There is a lack of ionization events early on (between 0 and 160 ns) compared to the background (ground state) signal that manifests itself as a sharp negative peak. This is because the lifetime of Rydberg Ps is orders of magnitude larger than the ground state lifetime.

Later on at ~ 200 ns, we observe a bump that arises from an excess of Rydberg atoms crashing into Grid 2. Finally, we see a long positive tail due to long-lived Rydberg atoms crashing into the chamber walls.


Figure 2: Trajectory simulation of Rydberg Ps atoms travelling through the ~0 V/cm electric field region (left panel) and measured background-subtracted gamma-ray flux , the shaded region indicates the average time during which Ps atoms  travel from he Target to Grid 2 (right panel).

On the other hand, when the applied electric field is large enough, all atoms are quickly ionized as they enter the ionizing region. Correspondingly, the ionization signal in this case is large and positive early on (again between 0 and 160 ns). Furthermore, instead of a long positive tail, we now have a long negative tail due to the lack of annihilations later in the experiment (since most, if not all, atoms have already been ionized). Importantly, since in this case field ionization occurs almost instantaneously as the atoms enter the ionization region, the shape of the initial ionization peak is a function of the velocity distribution of the atoms in the direction of propagation of the beam.


Figure 3: Trajectory simulation of Rydberg Ps atoms travelling through the ~2.6 kV/cm electric field region (left panel) and measured background-subtracted gamma-ray flux , the shaded region indicates the average time during which Ps atoms  travel from he Target to Grid 2 (right panel).

We measure these annihilation signal profiles over a range of fields and calculate the signal parameter S. A positive value of S implies that there is an excess of ionization occurring within the ionization region; whereas, a negative S means that there is a lack of ionization within the region with respect to background. Therefore, if S is approximately  equal to 0%, only half of the Ps atoms re being ionized. A plot of the experimental S parameter for different applied fields and for different n’s is shown in the plot below.Figure 4: Electric field scans for a range of n states ranging from 18 to 25 showing that at low electric fields none of the states ionize (thus the negative values of S) and as the electric field is increased, different n states can be observed to have varying ionizing electric field thresholds.

It is clear that different n-states can be distinguished using these characteristic S curves. However, the main drawback in this method is that both the background subtracted profiles and the S curves are convoluted with the velocity profile of the beam of Rydberg Ps atoms. This drawback can be eliminated by performing pulsed field ionization.

Pulsed Electric Field Configuration

We have also demonstrated the possibility of distinguishing different Rydberg states of positronium by ionization in a ramped electric field. The set-up is the same as in the static field scenario but now instead of fixing a potential on Grid 2, the potential on this grid is decreased from 3 kV to 0 kV hence increasing the field from 0 kV/cm to ~ 1800 kV/cm (the initial 3kV is necessary to help cool down Ps [New J. Phys17,043059 (2015)]).

The advantage of performing state selective field ionization this way is that we can allow most of the atoms to enter the ionization region before pulsing the field. This eliminates the dependence of the signal on the velocity distribution of the atoms and thus the signal is only dependent on the ionization rates of that Rydberg state in the increasing electric field.

Below is a plot of our results with a comparison to simulations (dashed lines). We see broad agreement between simulation and experiment and, we are able to distinguish between different Rydberg states depending on where in time the ionization peak occurs. This means that we should be able to detect a change in an initially prepared Rydberg population due to some process such as microwave induced transitions.

Figure 5: Pulsed-field ionization signal as a function of electric field for a range of n states.

The development of state selective ionization techniques for Rydberg Ps opens the door to measuring the effect of blackbody transitions on an initially prepared Rydberg population and a methodology for detecting transitions between nearby Rydberg-levels in Ps. Which could also be used for electric field cancellation methods to generate circular Rydberg states of Ps.

Production and time-of-flight measurements of high Rydberg states of Positronium

One of our recent studies focused on measuring the lifetimes of Rydberg states of Positronium (Ps) [PRA. 93, 062513]. However, some of the limitations that prevented us from measuring lifetimes of states with higher principal quantum number (n), is the fact that such states can be easily ionised by the electric fields generated by the electrodes in our laser-excitation region (these electrodes are normally required to achieve an excitation electric field of nominally ~ 0 V/cm).

We have recently implemented a simple scheme to overcome this complication, whereby we make use of a high-voltage switch to turn discharge the electrodes in the interaction region after the laser excitation has taken place.

n19ionThe figure shown above show the Background-subtracted spectra (the SSPALS detector trace is recorded with a background and resonant wavelength, they are then normalised and subtracted from each other) for n = 18 and n = 19. It is clear from the “Switch Off” that when the high voltage switched is not utilised (and the voltages to all electrodes are always on), that most of the annihilations happen at early times, especially around ~100ns, this is the time it takes for the atoms to travel out of the low-field region, and become field-ionised by the DC voltage on the electrodes.

On the other hand, the “Switch On” curves show that both n = 18 and 19 have many more delayed events (after ~ 400 ns) due to Rydberg Ps being able to travel for much longer distances before annihilating when the switch is used to discharge the electrode biases.

n19ion_tof

The figure above shows  data taken by a detector set up for single-gamma-ray detection, approximately 12 cm away from the Ps production target, on the same experiment as described for the previous figure. It is clear from this data that the time-of-flight (TOF) to this detector is ~2 \mu \mathrm{s} However, in this case it is clear that only the n = 19 state benefited from having the “switch on”, indicating that is the smallest-n state that this scheme is necessary for our current electric-field configuration.

Comparing the SSPALS and TOF figures it can be seen that even though the n = 18 SSPALS signal was changed drastically, the n = 18 TOF distribution remained the same, this is a clear example of how changes in the SSPALS spectrum discussed in the first figure are indicative of changes in atom distributions close to the Ps production region, but are not necessarily correlated to TOF distributions measured at different positions across the Ps flight paths

These methods will eventually lead to more accurate measurement of the lifetimes of higher n-states of Ps, and the possibility of using those states with higher electric dipole moments for future atom-optics experiments, such as Ps electrostatic lenses and Stark decelerators.

Efficient production of n = 2 Positronium in S states

We routinely excite Positronium (Ps) into its first excited state (n = 2) via 1-photon resonant excitation [NJP. 17 043059], and even though most of the time this is an intermediate step for subsequent excitation to Rydberg (high n) states [PRL. 114, 173001], there is plenty of interesting physics to be explored in n = 2 alone, as we discussed in one of our recent studies [PRL. 115, 183401 and  PRA. 93, 012506].

In this study we showed that the polarisation of the excitation laser, as well as the electric field that the atoms are subjected to, have a drastic effect on the effective lifetime of the excited states and when Ps annihilates.

qexp

Above you can see the data for two laser polarisations, showing the Signal parameter S(%) as a function of electric field, this is essentially a measure of how likely Ps is to annihilate compared to ground-state (n = 1) Ps, that is to say, if S(%) is positive then n = 2 Ps in such configuration annihilates with shorter lifetimes than n = 1 Ps (142 ns), whereas if S(%) is negative then n = 2 Ps will annihilate with longer lifetimes than 142 ns, These longer lifetimes are present in the parallel polarisation (pannel a).

Using this polarisation, and applying a large negative or positive electric field (around 3 kV/cm), provides such long lifetimes due to the excited state containing a significant amount of triplet S character (2S), a substate of = 2 with spin = 1 and \ell = 0. If the Ps atoms are then allowed to travel (adiabatically) to a region of zero nominal electric field (our experimental set-up [RSI. 86, 103101] guarantees such transport), then they will be made up almost entirely of this long-lived triplet S character, and will thus annihilate at much later times than the background n = 1 atoms. These delayed annihilations can be easily detected by simply looking at the gamma-ray spectrum recorded by our LYSO detectors [NIMA. 828, 163] when the laser is on resonance (“Signal”), and subtracting it from the spectrum when the laser is off resonance (“Background”).

The figure above shows such spectra taken with the parallel laser polarisation, at a field where there should be minimal 2S Production (a), and a field where triplet S character is maximised (b).   It is obvious that on the second case, there are far more annihilations at later times, indicated by the positive values of the data on times up to 800 ns. This is clear evidence that we have efficiently produced = 2 triplet S states of Ps using single-photon excitation. Previous studies of 2S Ps produced such states either by collisional methods [PRL34, 1541], which is much more inefficient than single-photon excitation,  or by two-photon excitation, which is also more inefficient, requires much more laser power and is limited by photo-ionisation [PRL. 52, 1689].

This observation is the initial step before we begin a new set of experiments where we  will attempt to measure the = 2 hyperfine structure of Ps using microwaves!

A guide to positronium

Positronium (Ps) is a hybrid of matter and antimatter. Made of just two particles – an electron and a positron – the atomic structure of Ps is similar to hydrogen. The ultimate aim of our experiments at UCL is to observe deflection of a Ps beam due to gravity, as nobody knows if antimatter falls up or down.

In this post, we outline how we recently managed to guide positronium using a quadrupole. Because the Ps atom doesn’t have a heavy nucleus, it’s extremely light and will typically move very, very quickly (~100 km/s). A refinement of the guiding techniques we used can, in principle, be applied to decelerate Ps atoms to speeds that are more suitable for studying gravity.

IMG_20160704_190341-01-01
Point-of-view of a Ps atom entering a quadrupole guide

Before guiding positronium we have to create some. Positrons emitted from a radioisotope of sodium are trapped in a combination of electric and magnetic fields. They are ejected from the trap and implanted into a thin-film of mesoporous silica, where they bind to electrons to form Ps atoms; the network of tiny pores provides a way for these to get out and into vacuum.

The entire Ps distribution is emitted from the film in a time-window of just a few billionths of a second.  This is well matched to our pulsed lasers, which we use to optically excite the atoms to Rydberg levels (high principal quantum number, n). If we didn’t excite the Ps then the electron-positron pairs would annihilate into gamma-ray photons in much less than a millionth of a second, and each would be unlikely to travel more than a few cm. However, in the excited states self-annihilation is almost completely suppressed and they can, therefore, travel much further.

Each Rydberg level contains many sublevels that have almost the same internal energy. This means that for a given n its sublevels can all be populated using a narrow range of laser wavelengths. But if an electric field is applied the sublevels are shifted. This so-called “Stark shift” comes from the electric dipole moment, i.e., the distribution of electric charge within the atom. The dipole is different for each sublevel and it can either be aligned or anti-aligned to the electric field. This results in a range of both positive and negative energy shifts, broadening the overall spectral line. Tuning the laser wavelength can now be used to select a particular sublevel. Or rather, to select a Rydberg-Stark state with a particular electric dipole moment. Stark broadening is demonstrated in the plot below. [For higher electric fields the individual Stark states can be resolved.]

linescan_fancy
Stark broadening of n=12 Ps in an electric field.

The Stark effect provides a way to manipulate the motion of neutral atoms using electric fields. As an atom moves between regions of different electric field strength its internal energy will shift according to its electric dipole moment. However, because the total energy must be conserved the kinetic energy will also change. Depending on whether the atom experiences a positive or negative Stark shift, increasing fields will either slow it down or speed it up. The Rydberg-Stark states can ,therefore, be broadly grouped as either low-field-seeking (LFS) or high-field-seeking (HFS). The force exerted by the electric field is much smaller than would be experienced by a charged particle. Nevertheless, this effect has been demonstrated as a useful tool for deflecting, guiding, decelerating, and trapping Rydberg atoms and polar molecules.

quadrupole_cartoon
Rydberg positronium source, lasers, gamma-ray detectors, and quadrupole guide.

A quadrupole is a device made from a square array of parallel rods.  Positive voltage is applied to one diagonal pair and negative to the other. This creates an electric field that is zero along the centre but which is very large directly between neighbouring rods. The effect this has on atoms in LFS states is that when they drift away from the middle into the high fields they slow down, and eventually turn around and head back towards the centre, i.e., they are guided. On the other hand, atoms in HFS states are steered away from the low-field region and out to the side of the quadrupole.

Stark
Electric field strength and trajectory calculation for low-field-seeking (blue),  high-field-seeking (red), and unaffected (green) Rydberg-Stark states of positronium in a quadrupole guide.

Using gamma-ray detectors at either end of a 40 cm long quadrupole we measured how many Rydberg Ps atoms entered and how many were transported through it. With the guide switched off some atoms from all states were transmitted. However, with the voltages switched on there was a five-fold increase in the number of low-field-seeking atoms getting through, whereas the high-field-seeking atoms could no longer pass at all.

total_fancy2
The number of Rydberg Ps atoms entering (red) and passing all the way through (blue) the quadrupole guide.

A large part of why we chose to use positronium for our gravity studies is that it’s electrically neutral. As the electromagnetic force is so much stronger than gravity we, therefore, avoid otherwise overwhelming effects from stray electric fields. However, by exciting Ps to Rydberg-Stark states with large electric dipole moments we reintroduce the same problem. Nonetheless, it should be possible to exploit the LFS states to decelerate the atoms to low speeds, and then we can use microwaves to drive them to states with zero dipole moment. This will give us a cold Rydberg Ps distribution that is insensitive to electric fields and which can be used for gravitational deflection measurements.


Our article “Electrostatically guided Rydberg positronium” has been published in Physical Review Letters.

Antimatter annihilation, gamma rays, and Lutetium-yttrium oxyorthosilicate

Doing experiments with antimatter presents a number of challenges. Not least of these is that when a particle meets its antiparticle the two will quickly annihilate. As far as we know we live in a universe that is dominated by matter. We are certainly made of matter and we run experiments in matter-based labs. How then can we confine positrons (anti-electrons) when they disappear on contact with any of our equipment?

Paul Dirac – the theoretical physicist who predicted the existence of antiparticles almost 90 years ago – proposed the solution even before there was evidence that antimatter was any more than a theoretical curiosity. In 1931 Dirac wrote,

“if [positrons] could be produced experimentally in high vacuum they would be quite stable and amenable to observation.”

P. A. M. Dirac (1931) 

Our positron beamline makes use of vacuum chambers and pumps to achieve pressures as low as 12 orders of magnitude less than atmosphere. Inside of our buffer-gas trap, where the vacuum is deliberately not so vacuous, the positrons can still survive for several seconds without meeting an electron. And as positrons are electrically charged they can easily be prevented from touching the chamber walls using a combination of electric and magnetic fields. (For neutral forms of antimatter the task is more difficult.  Nevertheless, the ALPHA experiment was able to trap antihydrogen for 1000 s using a magnetic bottle.)

An antiparticle can be thought of as a mirror image of a particle, with a number of equal but opposite properties, such as electric charge. When the two meet and annihilate, these properties sum to zero and nothing remains. Well, almost nothing. Electrons and positrons have the same mass (m = 9.10938356 × 10⁻³¹ kg), and when the two annihilate this is converted to energy in accordance with Einstein’s well-known formula

 E = m c2,

where c is the speed of light (299792458 m/s). For this reason antimatter has long fascinated science fiction writers: there is a potentially vast amount of energy available – e.g., for propelling spaceships or destroying the Vatican – when only a small amount of antimatter annihilates with matter. However, the difficulty in accumulating even minuscule amounts means that applications in weaponry and propulsion are a very long way from viable.

When an electron and positron annihilate the energy takes the form of gamma-ray photons. Usually two, each with 511 keV of energy. Although annihilation raises some difficulties, the distinct signature it produces can be very useful for detection purposes. Gamma rays are hundreds of thousands of times more energetic than visible photons. To detect them we use scintillation materials that absorb the gamma ray energy and then emit visible light. Photo-multiplier tubes are then used to convert the visible photons into an electric current, which can then be recorded with an oscilloscope.

Many materials are known to scintillate when exposed to gamma rays, although their characteristics differ widely. The properties that are most relevant to our work are the density (which must be high to absorb the gamma rays), the length of time that a scintillation signal takes to decay (this can vary from a few ns to a few μs), and the number of visible photons emitted, i.e., the light output.

NaI

Encased sodium iodide crystal 

Sodium iodide (NaI) is a popular choice for antimatter research because the light output is very high, therefore individual annihilation events can easily be detected.  However, for some applications the decay time is too long (~1 μs).

NaI_gamma-rays

PMT output for individual gamma-ray  detection with NaI

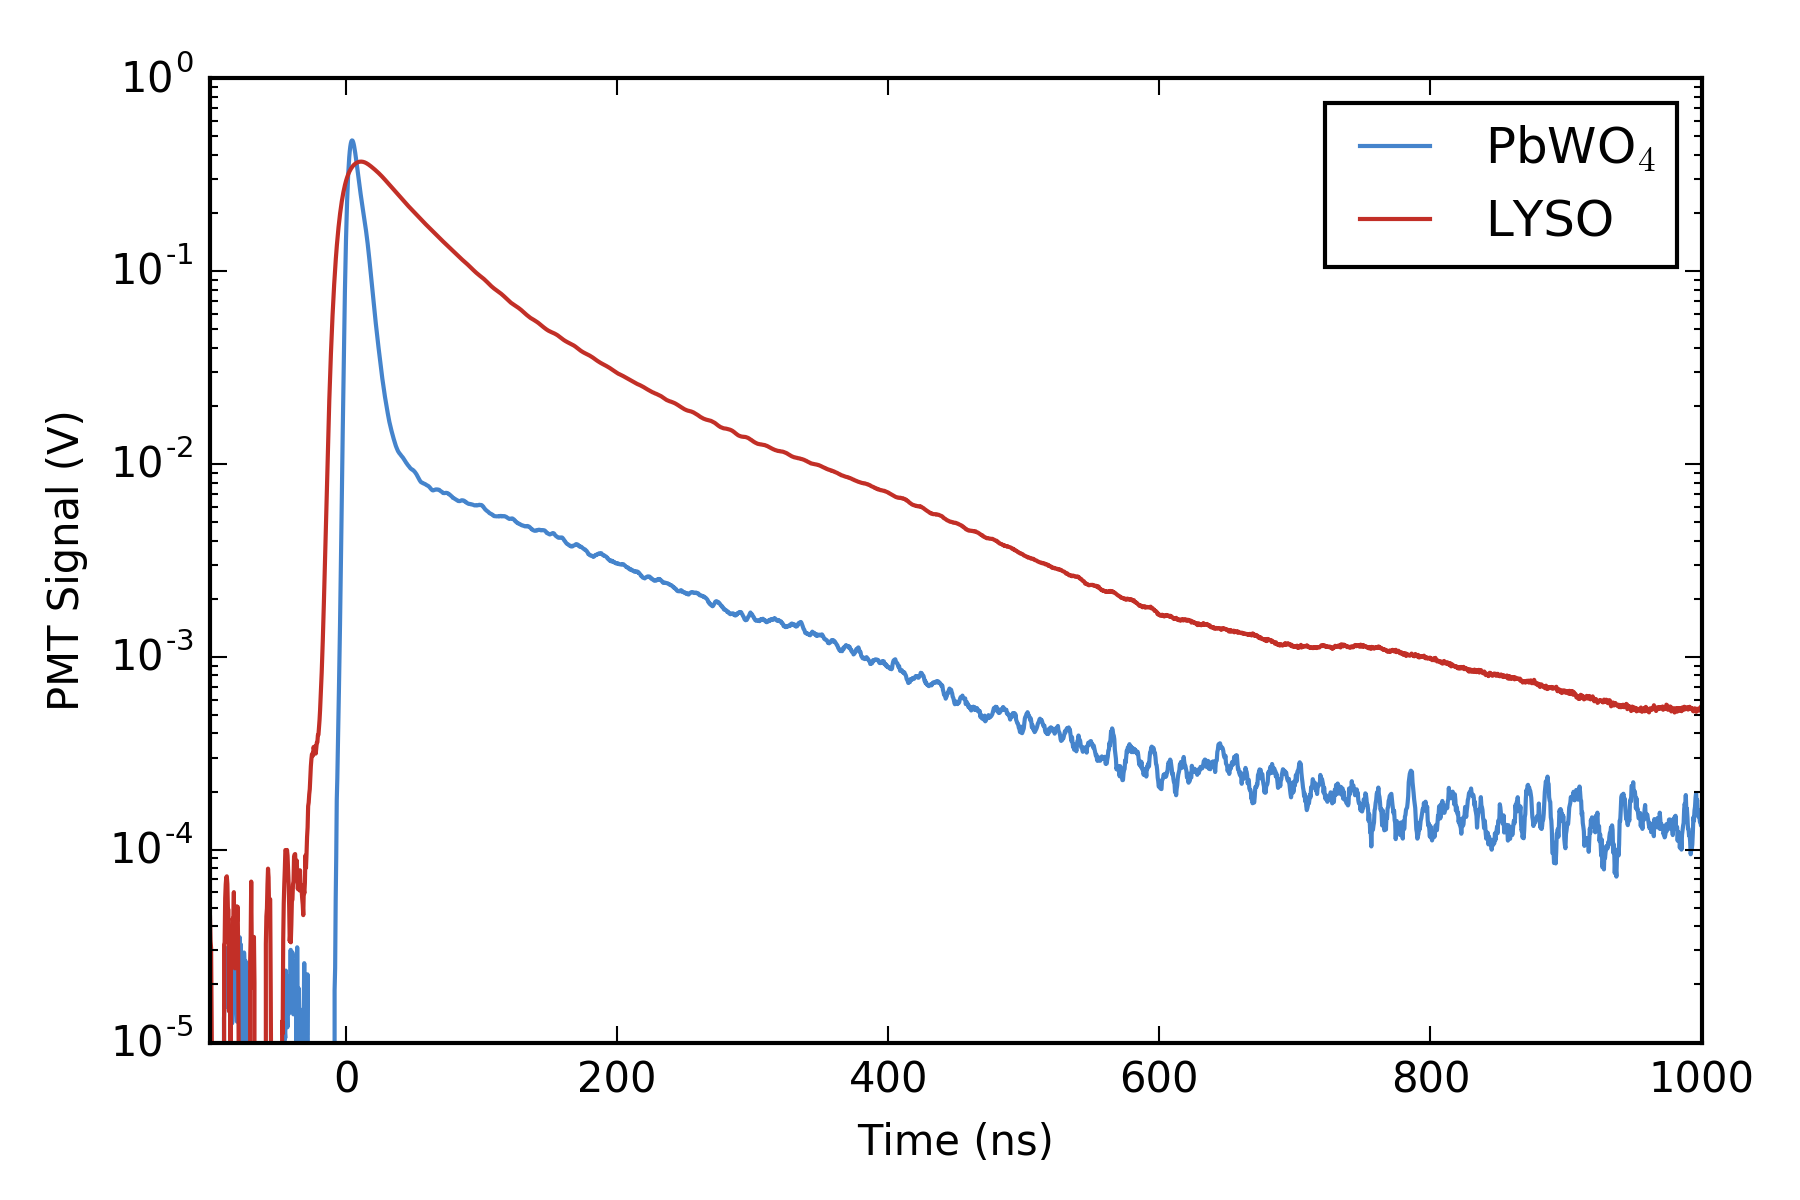
The material we normally use to perform single-shot positron annihilation lifetime spectroscopy (SSPALS) is lead tungstate (PbWO4) – the same type of crystal is used in the CMS electromagnetic calorimeter. This material has a fast decay time of around 10 ns, which allows us to resolve the 142 ns lifetime of ground-state positronium (Ps).  However, the amount of visible light emitted from PbWO4 is relatively low (~ 1% of NaI).

Recently we began experimenting with using Lutetium-yttrium oxyorthosilicate (LYSO) for SSPALS measurements, even though its decay time of ~40 ns is considerably slower than that of PbWO4.  So, why LYSO?  The main reason is that it has a much higher light output (~ 75% of NaI), therefore we can more efficiently detect the gamma rays in a given lifetime spectrum, and this significantly improves the overall statistics of our analysis.

lyso

An array of LYSO crystals

The compromise with using LYSO is that the longer decay time distorts the lifetime spectra and reduces our ability to resolve fast components. However, most of our experiments involve using lasers to alter the lifetime of Ps (reducing it via magnetic quenching or photoionisation; or extending it by exciting the atoms to Rydberg levels), and we generally care more about seeing how much the 142 ns component changes than about what happens on shorter timescales.   The decay time of LYSO is just about fast enough for this, and the improvement in contrast between signal and background measurements – which comes with the improved statistics – outweighs the loss in timing resolution.

pwo_lyso.png

SSPALS with LYSO and PbWO4


This post is based on our recent article:

Single-shot positron annihilation lifetime spectroscopy with LYSO scintillators, A. M. Alonso, B. S. Cooper, A. Deller, and D. B. Cassidy, Nucl. Instrum. Methods :  A  828, 163 (2016) DOI:10.1016/j.nima.2016.05.049.

How long does Rydberg positronium live?

Time-of-flight (TOF) is a simple but powerful technique that consists of accurately measuring the time it takes a particle/ atom/ ion/ molecule/ neutrino/ etc. to travel a known distance.  This valuable tool has been used to characterise the kinetic energy distributions of an exhaustive range of sources, including positronium (Ps) [e.g. Howell et al, 1987], and is exploited widely in ion mass spectrometry.

Last year we published an article in which we described TOF measurements of ground-state (n=1) Ps atoms that were produced by implanting a short (5 ns) pulse of positrons into a porous silica film.  Using pulsed lasers to photoionise (tear apart) the atoms at a range of well-defined positions, we were able to estimate the Ps velocity distribution, finding mean speeds on the order of 100 km/s. Extrapolating the measured flight paths back to the film’s surface indicated that the Ps took on average between 1 and 10 ns to escape the pores, depending on the depth to which the positrons were initially implanted.

When in the ground state and isolated in vacuum the electron and positron that make up a positronium atom will tend to annihilate each another in around 140 ns.  Even with a speed of 100 km/s this means that Ps is unlikely to travel further than a couple of cm during its brief existence.  Consequently,  the photoionisation/ TOF measurements mentioned above were made within 6 mm of the silica film. However, instead of ionising the atoms, our lasers can be reconfigured to excite Ps to high-n Rydberg levels, and these typically live for a great deal longer.   The increase in lifetime allows us to measure TOF spectra over much longer timescales (~10 µs) and distances (1.2 m).

TOF_schem

The image above depicts the layout of our TOF apparatus.  Positrons from a Surko trap are guided by magnets to the silica film, wherein they bind to electrons and are remitted as Ps.  Immediately after, ultraviolet and infra-red pulsed lasers drive the atoms to n=2 and then to Rydberg states.  Unlike the positively charged positrons, the neutral Ps atoms are not deflected by the curved magnetic fields and are able to travel straight along the 1.2 m flight tube, eventually crashing into the end of the vacuum chamber.  The annihilation gamma rays are there detected using an NaI scintillator and photomultipler tube (PMT), and the time delay between Ps production and gamma ray detection is digitally recorded.

unknown


The plots above show two different views of time-of-flight spectra accumulated with the infra-red laser tuned to address Rydberg levels in the range of n=10 to 20.  The data shows that more Ps are detected at later times for the higher-n states than for lower-n states.  This is easily explained by fluorescence, i.e., the decay of an excited-state atom via spontaneous emission of a photon.  As the fluorescence lifetime increases with n, the lower-n states are more likely to decay to the ground state and then annihilate before reaching the end of the chamber, reducing the number of gamma rays seen by the NaI detector at later times. We estimate from this data that Ps atoms in n=10 fluoresce in about 3 µs, compared to roughly 30 µs for n=20.

This work brings us an important step closer to performing a positronium free-fall measurement.  A flight path of at least ten meters will probably be required to observe gravitational deflection, so we still have some way to go.


This post is based on work discussed in our article:

Measurement of Rydberg positronium fluorescence lifetimes. A. Deller, A. M. Alonso, B. S. Cooper, S. D. Hogan, and D. B. Cassidy. Phys. Rev. A 93, 062513  (2016)DOI:10.1103/PhysRevA.93.062513.

UCL positronium spectroscopy beamline (the first two years)

The UCL Ps spectroscopy positron beamline began producing low-energy positrons almost two years ago, and it has since become slightly longer and somewhat more sophisticated. Though it’s not the most complex scientific machine in the world (compared to, e.g., the LHC) we still find regular use for a 3D depiction of it.  Our model is essentially a cartoon. Typically we use it to create (fairly) accurate schematics that help us to convey the configuration of our equipment at conferences or in publications.

UCL_positron_trap

The snap shot above shows the three main components of the beamline, namely the positron source (left), Surko trap (centre, cross-section), and Ps laser-spectroscopy region (right).  The 3D model is built from simplified forms of the various vacuum chambers and pumps, magnetic coils, and detectors.  And it shows where these all are in relation to one another.  The 45° angled line is being used right now for Rydberg Ps time-of-flight measurements.  The source and trap are based on the design developed by Rod Greaves and Jeremey Moxom of First Point Scientific Inc. (unfortunately now defunct).  You can read about the details of their design in this article.

To allow you to take a closer look we have created a 3D pdf file that you can download here * (licensed under a Creative Commons Attribution 4.0 License). Be aware we use this for illustration/ communication purposes and it is not an accurate technical model. Nonetheless, using this you can pan, zoom, and rotate around our virtual lab to your heart’s content! No need for 3D glasses, though you will need a recent copy of Adobe reader,  (the interactive features probably won’t work in your web browser).

*MD5 checksum c6028573596c9511d9ba0450cd2caa05

And here’s how the lab looks in real life,

beamline_2016_3


Photoemission of Ps from single-crystal p-Ge semiconductors

The production of positronium in a low-temperature (cryogenic) environment is in general only possible using materials that operate via non-thermal processes. In previous experiments we showed that porous silica films can be used in this way at temperatures as low as 10 K, but that Ps formation at these temperatures can be inhibited by condensation of residual gas, or by laser irradiation.

It has been known for several years now that some semiconductors can produce Ps via an exciton-like surface state [12]. Si and Ge are the only semiconductors that have been studied so far, but it is likely that others will work in a similar way. The electronic surface state(s) underlying the Ps production can be populated thermally, resulting in temperature dependent Ps formation that is very similar to what is observed in metals (for which the Ps is actually generated via thermal desorption of positrons in surface states). Since laser irradiation can also populate electronic surface states, and is known to result in Ps emission from Si at room temperature, the possibility exists that this process can be used at cryogenic temperatures.

We have studied this possibility using p-type Ge(100) crystals. Initial sample preparation involves immersion in acid (HCl) and this process leaves the sample with Chlorine-terminated dangling bonds which can be thermally desorbed. We attached the samples to a cold head with a high temperature interface  that can be heated to 700 K and cooled to 12 K. The heating is necessary to remove Cl from the crystal surface, which otherwise inhibits Ps formation. Fig 1 shows the initial heating cycle that prepares the sample for use. The figure shows the delayed annihilation fraction (which is proportional to the amount of positronium) as a function of temperature.

photoweb

FIG. 1:  Delayed fraction as a function of sample temperature after initial installation into the vacuum system. After the surface Cl has been thermally desorbed the amount of Ps emitted at room temperature is substantially increased.

As has been previously observed [2] using visible laser light at 532 nm can increase the Ps yield. This occurs because the electrons necessary for Ps formation can be excited to surface states by the laser. However, these states have a finite lifetime, and as both the laser and positron pulses are typically around 5 ns wide these have to be synchronized in order to optimise the photoemission effect. This is shown in FIG 2.  These data indicate that the electronic surface states are fairly short lived, with lifetimes of less than 10 ns or so. Longer surface states were observed in similar measurements using Si.

phototime web

FIG 2: Delayed fraction as a function of the arrival time of the laser relative to the incident positron pulse. These data are recorded at room temperature.  The laser fluence was ~ 15 mJ/cm^2

When Ge is cooled the Ps fraction drops significantly. This is not related to surface contamination, but is due to the lack of thermally generated surface electrons. However, surface contamination does further reduce the Ps fraction (much more quickly than is the case for silica. This effect is shown in FIG 3. If a photoemission laser is applied to a cold contaminated Ge sample two things happen (1) the laser desorbs some of the surface material and (2) photoemission occurs .This means that Ge can be used to produce Ps with a high efficiency at any temperature, and we don’t even have to worry about the vacuum conditions (within some limits).

laser_powers

FIG 3: Delayed fraction as a function of time that the target was exposed to showing the effect that different laser fluences has on the photoemission process. During irradiation, the positronium fraction is noticeably increased.

There are many possible applications for cryogenic Ps production within the field of antimatter physics, including the formation of antihydrogen formation via Ps collision with antiprotons [3], Ps laser cooling and Bose Einstein Condensation [4], as well as precision spectroscopy.

[1] Positronium formation via excitonlike states on Si and Ge surfaces. D. B. Cassidy, T. H. Hisakado, H. W. K. Tom, and A. P. Mills, Jr. Phys. Rev. B, 84, 195312 (2011). DOI:10.1103/PhysRevB.84.195312.

[2] Photoemission of Positronium from Si. D. B. Cassidy, T. H. Hisakado, H. W. K. Tom, and A. P. Mills, Jr. Phys. Rev. Lett. 107, 033401 (2011). DOI:10.1103/PhysRevLett.107.033401.

[3] Antihydrogen Formation via Antiproton Scattering with Excited Positronium. A. S. Kadyrov, C. M. Rawlins, A. T. Stelbovics, I. Bray, and M. Charlton. Phys. Rev. Lett. 114, 183201 (2015). DOI:10.1103/PhysRevLett.114.183201.

[4] Possibilities for Bose condensation of positronium. P. M. Platzman and A. P. Mills, Jr. Phys. Rev. B 49, 454 (1994). DOI:10.1103/PhysRevB.49.454.

ANTIMATTER: who ordered that?

The existence of antimatter became known following Dirac’s formulation of relativistic quantum mechanics, but this incredible development was not anticipated. These days conjuring up a new particle or field (or perhaps even new dimensions) to explain unknown observations is pretty much standard operating procedure, but it was not always so. The famous “who ordered that” statement of I. I. Rabi was made in reference to the discovery of the muon, a heavy electron whose existence seemed a bit unnecessary at the time; in fact it was the harbinger of a subatomic zoo.

The story of Dirac’s relativistic reformulation of the Schrödinger wave equation, and the subsequent prediction of antiparticles, is particularly appealing; the story is nicely explained in a recent biography of Dirac (Farmelo 2009). As with Einstein’s theory of relativity, Dirac’s relativistic quantum mechanics seemed to spring into existence without any experimental imperative. That is to say, nobody ordered it! The reality, of course, is a good deal more complicated and nuanced, but it would not be inaccurate to suggest that Dirac was driven more by mathematical aesthetics than experimental anomalies when he developed his theory.

The motivation for any modification of the Schrödinger equation is that it does not describe the energy of a free particle in a way that is consistent with the special theory of relativity. At first sight it might seem like a trivial matter to simply re-write the equation to include the energy in the necessary form, but things are not so simple. In order to illustrate why this is so it is instructive to briefly consider the Dirac equation, and how it was developed. For explicit mathematical details of the formulation and solution of the Dirac equation see, for example, Griffiths 2008.

The basic form of the Schrödinger wave equation (SWE) is

(-\frac{\hbar^2}{2m}\nabla^2+V)\psi = i\hbar \frac{\partial}{\partial t}\psi.                                                    (1)

The fundamental departure from classical physics embodied in eq (1) is the quantity \psi , which represents not a particle but a wavefunction. That is, the SWE describes how this wavefunction (whatever it may be) will behave. This is not the same thing at all as describing, for example, the trajectory of a particle. Exactly what a wavefunction is remains to this day rather mysterious. For many years it was thought that the wavefunction was simply a handy mathematical tool that could be used to describe atoms and molecules even in the absence of a fully complete theory (e.g., Bohm 1952). This idea, originally suggested by de Broglie in his “pilot wave” description, has been disproved by numerous ingenious experiments (e.g., Aspect et al., 1982). It now seems unavoidable to conclude that wavefunctions represent actual descriptions of reality, and that the “weirdness” of the quantum world is in fact an intrinsic part of that reality, with the concept of “particle” being only an approximation to that reality, only appropriate to a coarse-grained view of the world. Nevertheless, by following the rules that have been developed regarding the application of the SWE, and quantum physics in general, it is possible to describe experimental observations with great accuracy. This is the primary reason why many physicists have, for over 80 years, eschewed the philosophical difficulties associated with wavefunctions and the like, and embraced the sheer predictive power of the theory.

We will not discuss quantum mechanics in any detail here; there are many excellent books on the subject at all levels (e.g., Dirac 1934, Shankar 1994, Schiff 1968). In classical terms the total energy of a particle E can be described simply as the sum of the kinetic energy (KE) and the potential energy (PE) as

KE+PE=\frac{p^2}{2m}+V=E                                                 (2)

where p = mv represents the momentum of a particle of mass m and velocity v. In quantum theory such quantities are described not by simple formulae, but rather by operators that act on the wavefunction. We describe momentum via the operator -i \hbar\nabla and energy by i\hbar \partial / \partial t and so on. The first term of eq (1) represents the total energy of the system, and is also known as the Hamiltonian, H. Thus, the SWE may be written as

H\psi=i\hbar\frac{\partial\psi}{\partial t}=E\psi                                                              (3)

The reason why eq (3) is non-relativistic is that the energy-momentum relation in the Hamiltonian is described in the well-known non-relativistic form. As we know from Einstein, however, the total energy of a free particle does not reside only in its kinetic energy; there is also the rest mass energy, embodied in what may be the most famous equation in all of physics:

E=mc^2.                                                                    (4)

This equation tells us that a particle of mass m has an equivalent energy E, with c2 being a rather large number, illustrating that even a small amount of mass (m) can, in principle, be converted into a very large amount of energy (E). Despite being so famous as to qualify as a cultural icon, the equation E = mc2 is, at best, incomplete. In fact the total energy of a free particle (i.e., V = 0) as prescribed by the theory of relativity is given by

E^2=m^2c^4 +p^2c^2.                                                        (5)

Clearly this will reduce to E = mc2 for a particle at rest (i.e., p = 0): or will it? Actually, we shall have E = ± mc2, and in some sense one might say that the negative solutions to this energy equation represent antimatter, although, as we shall see, the situation is not so clear cut. In order to make the SWE relativistic then, one need only replace the classical kinetic energy E = p2/2m with the relativistic energy E = [m2c4+p2c2]1/2. This sounds simple enough, but the square root sign leads to quite a lot of trouble! This is largely because when we make the “quantum substitution” p \rightarrow -i\hbar\nabla  we find we have to deal with the square root of an operator, which, as it turns out, requires some mathematical sophistication. Moreover, in quantum physics we must deal with operators that act upon complex wavefunctions, so that negative square roots may in fact correspond to a physically meaningful aspect of the system, and cannot simply be discarded as might be the case in a classical system.

To avoid these problems we can instead start with eq (5) interpreted via the operators for momentum and energy so that eq (3) becomes

(- \frac{1}{c^2}\frac{\partial^2}{\partial t^2} + \nabla^2)\psi=\frac{m^2 c^2}{\hbar^2}\psi.                                                (6)

This equation is known as the Klein Gordon equation (KGE), although it was first obtained by Schrödinger in his original development of the SWE. He abandoned it, however, when he found that it did not properly describe the energy levels of the hydrogen atom. It subsequently became clear that when applied to electrons this equation also implied two things that were considered to be unacceptable; negative energy solutions, and, even worse, negative probabilities. We now know that the KGE is not appropriate for electrons, but does describe some massive particles with spin zero when interpreted in the framework of quantum field theory (QFT); neither mesons nor QFT were known when the KGE was formulated.

Some of the problems with the KGE arise from the second order time derivative, which is itself a direct result of squaring everything to avoid the intractable mathematical form of the square root of an operator. The fundamental connection between time and space at the heart of relativity leads to a similar connection between energy and momentum, a connection that is overlooked in the KGE. Dirac was thus motivated by the principles of relativity to keep a first order time derivative, which meant that he had to confront the difficulties associated with using the relativistic energy head on. We will not discuss the details of its derivation but will simply consider the form of the resulting Dirac equation:

(c \alpha \cdot \mathrm{P}+\beta mc^2)\psi=i\hbar \frac{\partial\psi}{\partial t}.                                                     (7)

This equation has the general form of the SWE, but with some significant differences. Perhaps the most important of these is that the Hamiltonian now includes both the kinetic energy and the electron rest mass, but the coefficients αi and \beta  have to be four-component matrices to satisfy the equation. That is, the Dirac equation is really a matrix equation, and the wavefunction it describes must be a four component wavefunction. Although there are no problems with negative probabilities, the negative energy solutions seen in the KGE remain. These initially seemed to be a fatal flaw in Dirac’s work, but were overlooked because in every other aspect the equation was spectacularly successful. It reproduced the hydrogen atomic spectra perfectly (at least, as perfectly as it was known at the time) and even included small relativistic effects, as a proper relativistic wave equation should. For example, when the electromagnetic interaction is included the Dirac equation predicts an electron magnetic moment:

\mu_e = \frac{\hbar e}{2m} = \mu_B                                                                   (8)

where \mu_B is known as the Bohr magneton. This expression is also in agreement with experiment, almost: it was later discovered that the magnetic moment of the electron differs from the value predicted by eq (8) by about 0.1% (Kusch and Foley 1948).  The fact that Dirac’s theory was able to predict these quantities was considered to be a triumph, despite the troublesome negative energy solutions.

Another intriguing aspect of the Dirac equation was noticed by Schrödinger in 1930. He realised that interference between positive and negative energy terms would lead to oscillations of the wavepacket of an electron (or positron) about some central point at the speed of light. This fast motion was given the name zitterbewegung (which is German for “trembling motion”). The underlying physical mechanism that gives rise to the zitterbewegung effect may be interpreted in several different ways but one way to look at it is as an interaction of the electron with the zero-point energy of the (quantised) electromagnetic field. Such electronic oscillations have not been directly observed as they occur at a very high frequency (~ 1021 Hz), but since zitterbewegung also applies to electrons bound to atoms, this motion can affect atomic energy levels in an observable way. In a hydrogen atom the zitterbewegung acts to “smear out” the electron charge over a larger area, lowering the strength of its interaction with the proton charge. Since S states have a non-zero expectation value at the origin, the effect is larger for these than it is for P states. The splitting between the hydrogen 2S1/2 and 2P1/2 states, that are degenerate in the Dirac theory, is known as the Lamb Shift (Lamb, 1947). This shift, which amounts to ~1 GHz was observed in an experiment by Willis Lamb and his student Robert Retherford (not to be confused Ernest Rutherford!). The need to explain this shift, which requires a proper explanation of the electron interacting with the electromagnetic field, gave birth to the theory of quantum electrodynamics, pioneered by Bethe, Tomanoga, Schwinger and Feynman.

The solutions to the SWE for free particles (i.e., neglecting the potential V) are of the form

\psi = A \mathrm{exp}(-iEt / \hbar).                                                       (9)

Here A is some function that depends only on the spatial properties of the wavefunction (i.e., not on t). Note that this wavefunction represents two electron states, corresponding to the two separate spin states. The corresponding solutions to the Dirac equation may be represented as

                                                            \psi_1 = A_1 \mathrm{exp}(-iEt / \hbar),

\psi_2 = A_2 \mathrm{exp}(+iEt / \hbar).                                                   (10)

Here \psi_2 represents the negative energy solutions that have caused so much trouble. The existence of these states is central to the theory they cannot simply be labelled as “unphysical” and discarded. The complete set of solutions is required in quantum mechanics, in which everything is somewhat “unphysical”. More properly, since the wavefunction is essentially a complex probability density function that yields a real result when its absolute value is squared, the negative energy solutions are no less physical than the positive energy solutions; it is in fact simply a matter of convention as to which states are positive and which are negative. However you set things up, you will always have some “wrong” energy states that you can’t get rid of. Thus, Dirac was able to eliminate the negative probabilities and produce a wave equation that was consistent with special relativity, but the negative energy states turned out to be a fundamental part of the theory and could not be eliminated, despite many attempts to get rid of them.

After his first paper in 1928 (The quantum theory of the electron) Dirac had established that his equation was a viable relativistic wave equation, but the negative energy aspects remained controversial. He worried about this for some time, and tried to develop a “hole” theory to explain their seemingly undeniable existence. A serious problem with negative energy solutions is that one would expect all electrons to decay into the lowest energy state available, which would be the negative energy states. Since this would not be consistent with observations there must, so Dirac reasoned, be some mechanism to prevent it. He suggested that the states were already filled with an infinite “sea” of electrons, and therefore the Pauli Exclusion Principle would prevent such decay, just as it prevents more than two electrons from occupying the lowest energy level in an atom. (Note that this scheme does not work for Bosons, which do not obey the exclusion principle). Such an infinite electron sea would have no observable properties, as long as the underlying vacuum has a positive “bare” charge to cancel out the negative electron charge. Since only changes in the energy density of this sea would be apparent, we would not normally notice its presence. Moreover, Dirac suggested that if a particle were missing from the sea the resulting hole would be indistinguishable from a positively charged particle, which he speculated was a proton, protons being the only positively charged subatomic particles known at the time.

This idea was presented in a paper in 1930 (A Theory of Electrons and Protons, Dirac 1930). The theory was less than successful, however, and the deficiencies served only to undermine confidence in the entire Dirac theory. Attempts to identify holes as protons only made matters worse; it was shown independently by Heisenberg, Oppenheimer and Pauli that the holes must have the electron mass, but of course protons are almost 2000 times heavier. Moreover, the instability between electrons and holes completely ruled out stable atomic states made from these entities (bad news for hydrogen, and all other atoms). Eventually Dirac was forced to conclude that the negative energy solutions must correspond to real particles with the same mass as the electron and a positive charge. He called these anti-electrons (Quantised Singularities in the Electromagnetic Field, Dirac 1931).

This almost reluctant conclusion was not based on a full understanding of what the negative energy states were, but rather the fact that the entire theory, which was so beautiful in other ways that it was hard to resist, depended on them. It turns out that to properly understand the negative energy solutions requires the formalism of quantum field theory (QFT). In this description particles (and antiparticles) can be created or destroyed, so it is no longer necessarily appropriate to consider these particles to be the fundamental elements of the theory. If the total number of particles in a system is not conserved then one might prefer to describe that system in terms of the entities that give rise to the particles rather than the particles themselves. These are the quantum fields, and the standard model of particle physics is at its heart a QFT. By describing particles as oscillations in a quantum field not only do we have an immediate mechanism by which they may be created or destroyed, but the problem of negative energies is also removed, as this simply becomes a different kind of variation in the underlying quantum field. Dirac didn’t explicitly know this at the time, although it would be fair to say that he essentially invented QFT, when he produced a quantum theory that included quantized electromagnetic fields (Dirac, 1927, The Quantum Theory of the Emission and Absorption of Radiation). This led, eventually, to what would be known as quantum electrodynamics. Dirac would undoubtedly have been able to make much more use of his creation if he had not been so appalled by the notion of renormalization. Unfortunately this procedure, which in some ways can be thought of as subtracting infinite quantities from each other to leave a finite quantity, was incompatible with his sense of mathematical aesthetics.

So, despite initially struggling with the interpretation of his theory, there can be no question that Dirac did indeed explicitly predict the existence of the positron before it was experimentally observed. This observation came almost immediately in cloud chamber experiments conducted by Carl Anderson in California (C. D. Anderson: The apparent existence of easily deflectable positives, Science 76 238, 1932).  Curiously, however, Anderson was not aware of the prediction, and the proximity of the observation was apparently coincidental. We will discuss this remarkable observation in a later post.

*This post is adapted from an as-yet unpublished book chapter by D. B. Cassidy and A. P. Mills, Jr.


References:

Griffiths, D. (2008). Introduction to Elementary Particles Wiley-VCH; 2nd edition.

Farmelo, “The Strangest Man: The Hidden Life of Paul Dirac, Mystic of the Atom” Basic Books, New York, (2011).

Dirac, P.A.M. (1927). The Quantum Theory of the Emission and Absorption of Radiation, Proceedings of the Royal Society of London, Series A, Vol. 114, p. 243.

P. A. M. Dirac, Proc. Phys. Soc. London Sect. A 117, 610 (1928).

P. A. M. Dirac, Proc. Phys. Soc. London Sect. A 126, 360 (1930).

P. A. M. Dirac, Proc. Phys. Soc. London Sect. A 133, 60 (1931).

Anderson, C. D. (1932). The apparent existence of easily deflectable positives, Science 76, 238.

A.  Aspect, D. Jean, R. Gerard (1982). Experimental Test of Bell’s Inequalities Using Time- Varying Analyzers, Phys. Rev. Lett. 49 1804

P. Kusch and H. M. Foley “The Magnetic Moment of the Electron”, Phys. Rev. 74, 250 (1948).