Positronium formation detected using annihilation radiation energy spectroscopy

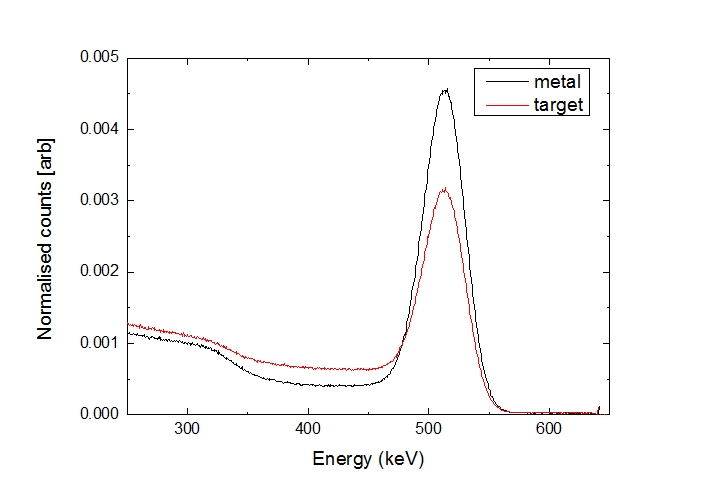
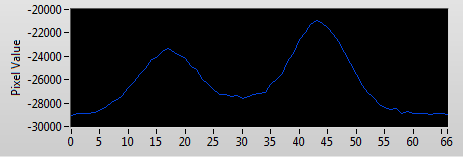
When a positron and an electron annihilate directly, instead of forming a Ps atom, all of their energy is converted into two gamma ray photons, each with 511 keV (the rest mass energy of the electron/positron). However, if an electron and a positron form a Ps atom the annihilation can occur either into two or three photons, depending on the spin state of the Ps atom. The longer-lived Ps state is called ortho-positronium (o-Ps), and in this system the electron and positron spins point in the same direction, so the total spin of the atom is 1. This means that o-Ps has to decay into an odd number of gamma rays in order to conserve angular momentum. Usually this means three photons, as single photon decay can only happen if there is a third body present (this has been observed). The three photon energies are spread out over a large range (but they always add up to 2 x 511 keV). The short-lived Ps state is called para-positronium (p-Ps) and this usually decays into two photons. It is possible for a three photon state to have zero angular momentum, so singlet decay into three photons is not ruled out by momentum considerations, but this mode is suppressed and to a good approximation p-Ps decays into two gamma rays with well-defined energies (i.e., 511 keV). This means that p-Ps decays look very similar to direct electron-positron decays. It also means that we can detect the presence of o-Ps by looking at the energy spectrum of annihilation radiation, as is shown in the graph below.

peakvalley3kV

We are able to measure gamma ray energies using a detector; in this case NaI(TI), or thallium doped sodium iodide. The data shown above were taken with a positron beam fired into a piece of untreated metal, from which we expect hardly any Ps to be made, and also in a silica film, which we know converts about 30% of the incident positrons into the Ps atoms. When the beam hits the metal many events at energies close to 511 keV are detected, since most positrons will annihilate directly into two 511 keV photons.
The production of Ps can be seen when we compare the two curves (red and black lines) shown in the figure. These spectra are normalised to have the same total area, so the excess of counts in the valley region (i.e., energies between about 300 and 500 keV), and the reduction of counts in the photopeak (at 511 keV) is exactly what you would expect if you made positronium: the decay into three photons means there are more photons with energies less than 511 keV.

New laser

We have set up our newest laser: a pulsed dye laser that will provide intense UV radiation with wavelength around 365 nm. We will focus this radiation to a small spot, irradiating the Ps atoms and driving two-photon transitions to Rydberg states of Ps. By retro-reflecting the UV radiation we will drive Doppler-free transitions, which will allow us to interact with a large range of atoms, covering the very wide Doppler-profile of the hot Ps atoms.

The advantage of this scheme is that we can drive the transitions to Rydberg states with narrow band pulsed dye lasers, which should allow us sufficient resolution to address individual Rydberg-Stark states when irradiating the atoms in a uniform electric field. This selective population will allow us to prepare the atoms in states ideal for manipulation with inhomogeneous electric fields, such as focussing and Rydberg-Stark deceleration.

Ps Spectroscopy

We have used our ultraviolet laser (a pulsed dye laser), in addition to a green laser, to ionize a significant fraction of the positronium (Ps) atoms produced by our beamline (read here for more details).

We first tune the UV laser to a wavelength of 243 nm, for which the photons have the same energy as the interval between the ground state and the first excited state of the positronium atom.

We carefully time the laser pulse to pass through the cloud of Ps atoms shortly after they’re created, and so many of the atoms absorb the light and become resonantly excited.  The photons in the green laser have sufficient energy to then ionise these excited atoms – separating the positron and electron.  This technique is known as resonant ionisation spectroscopy (RIS).

The positrons are very likely to fall back into the target and annihilate shortly after ionisation occurs, causing more gamma rays to be detected during the prompt peak of our SSPALS traces; with fewer o-Ps annihilations subsequently detected at later times.  An example SSPALS trace, with and without the laser, is shown below.

trace1

We quantify the ionisation by measuring the fraction of delayed annihilations in our SSPALS traces,

f = ∫(B→C)/∫(A→C)

and comparing it to a background measurement without the laser:

S = (flaser onflaser off)/flaser off

The figure below shows how this ionization signal, S, varies as we tune the UV laser across the resonant wavelength, 243nm, for the 1S-2P transition.

Ps_243nm

The width of the roughly Gaussian line-shape is caused by Doppler broadening, where the atoms moving towards, or away from the laser see a slightly shorter, or longer, wavelength.

The different coloured points represent different voltages applied to the Ps converter. This voltage creates an electric field that attracts and accelerates the positrons, implanting them into the material.  The highest target bias has the narrowest RIS line-shape as the Ps atoms form deep inside the sample and therefore experience more collisions as they make their way back to the surface, which slows them down and reduces the Doppler effect.

Positronium production

We have made positronium atoms by accelerating positrons from our trap into a porous silica target (which was supplied by Laszlo Liskay in Saclay). We observe the positronium atoms by single shot positronium annihilation lifetime spectroscopy (SSPALS – see here for more information). In this technique we record the gamma photons emitted as the positrons and positronium atoms annihilate. Approximately 50% of the positrons annihilate in the target, producing the large gamma peak observed within the first 20 ns of the trace below. Of the Ps atoms formed, around one quarter are in the very short-lived singlet state (para-positronium). With a lifetime against annihilation of only 120 ps, these atoms also contribute to the large peak. The remaining atoms occupy the triplet state (ortho-positronium) which, with a lifetime against annihilation of 142 ns, lives for over 1000 times longer than p-Ps. This increased lifetime leads to a long tail in the SSPALS trace which is characteristic of positronium generation.

The figure below shows two SSPALS data-sets: one taken with a porous silica target and one with a metal target. In both cases the implantation energy was 1 keV. In the case of the metal target (grey data) we observe no Ps formation, and there is only signal from positron annihilation. However, with  porous silica target (blue data) we record increased signal at times greater than 40 ns after implantation: the signature of Ps formation.

sspals

The porous silica target used in this experiment is an efficient source of cold Ps atoms. The incident positrons are accelerated into the bulk material, where they can either anniliate or form Ps. Once Ps has been formed it can diffuse out of the bulk and into the pores. Collisions with the walls of these pores cools the Ps atoms, ultimately to the lowest quantum state of the potential well. The cooled atoms can then diffuse out of the target through the interconnected pores and into the vacuum.

Ps_drawing

Trapped positrons

We have trapped positrons, and slowed and cooled them by collisions with N_2 buffer gas and CF_4 cooling gas. The images are 3D plots of the positrons detected on a phosphor screen (see banner at the top of the page).

densityPlots

The left-hand image shows the image resulting from the positron beams impinging on the phosphor screen, passing directly through the trap. The trap shows the distribution with a dip in the centre (see this post for an explanation of where this comes from). The right-hand image was generated by accumulating and cooling positrons in the trap for 1 second. The cloud of trapped positrons is then bunched and accelerated out of the trap and onto the screen.

Next step: we will accelerate these positrons onto a porous target and make positronium!

Positron beam

We have built a dc beam of positrons. After moderation in solid neon the positrons are magnetically guided away from the source,  through what will be our buffer gas trap, and onto a phosphor screen, located in front of a CCD camera.

Below is a typical image we have recorded of our positron beam.

positrons12May14

The beam has a roughly doughnut-shape, which is determined by the shape of the neon moderator (the moderator has a hollow centre, and so there are fewer of the slow positrons that we detect in the centre of the beam). This beam structure is highlighted in the following figure which shows the recorded beam intensity along a line (shown in the above figure).

positrons12May14

In this experiment we are recording around 2 million positrons per second, several metres downstream of the source.

This is an important step forward in our experiment. The next step will be to accumulate positrons in our trap, and then accelerate them onto a target for Ps production.

Positrons!

We now have our 22Na source installed in the chamber.

This photograph shows the source on the far left-hand side (encased in lead bricks). The emitted positrons are moderated in solid neon and are then magnetically guided through the vacuum chamber towards the trap (toward the right of the image, next to the gas cylinder).

DSC_0275

This plot shows how the moderator is grown by injecting neon gas in the source chamber up to a pressure of around 10^-4 mbar (red, dashed). The 22Na source is housed on the top of a cold head, maintained at around 7 K (blue). This is cold enough for the neon to freeze, which it does inside an aperture directly in front of the source. This solid block of neon forms the moderator which slows down the emitted positrons to speeds where we can easily guide and trap them. mod_3 The black curve shows the growth in detected slow positrons as the moderator is formed. The positrons are measured downstream of the source, directly in front of the trap.

Fluorescence!

This photo shows the fluorescence of Coumarin 102 dye (dissolved in methanol) as a laser beam (445 nm, 1.3 W cw) passes through.

Image

The end of the laser can be seen in the right-hand side of the photo. The image shows how the blue laser beam is invisible as it passes through the air, but its path becomes beautifully clear as it traverses the dye solution.

The laser drives electronic transitions in the dye, resulting in broad-band fluorescence. The beam is considerably attenuated as the dye is strongly absorbing at this wavelength, with almost all of the energy absorbed by the solution.

We will use this dye as the gain medium in our pulsed dye laser, pumping it at 355 nm to generate pulsed laser radiation at 486 nm, to drive the 1s -> 2p transition in positronium atoms.

Lasers arrive!

2014 has started with the arrival of our pulsed laser system – a Surelite Nd:YAG laser which pumps a Sirah pulsed dye laser.

Ps Spectroscopy lab, January 2014. Optical table and pulsed dye laser now installed.

lab Jan14

We will use this dye laser for driving electronic transitions in Ps, such as the 1s – 2p transition at 243 nm. The dye laser uses coumarin 102 as the gain medium, lasing at 486 nm, which is then doubled in BBO.

cobra1