CATMIN III

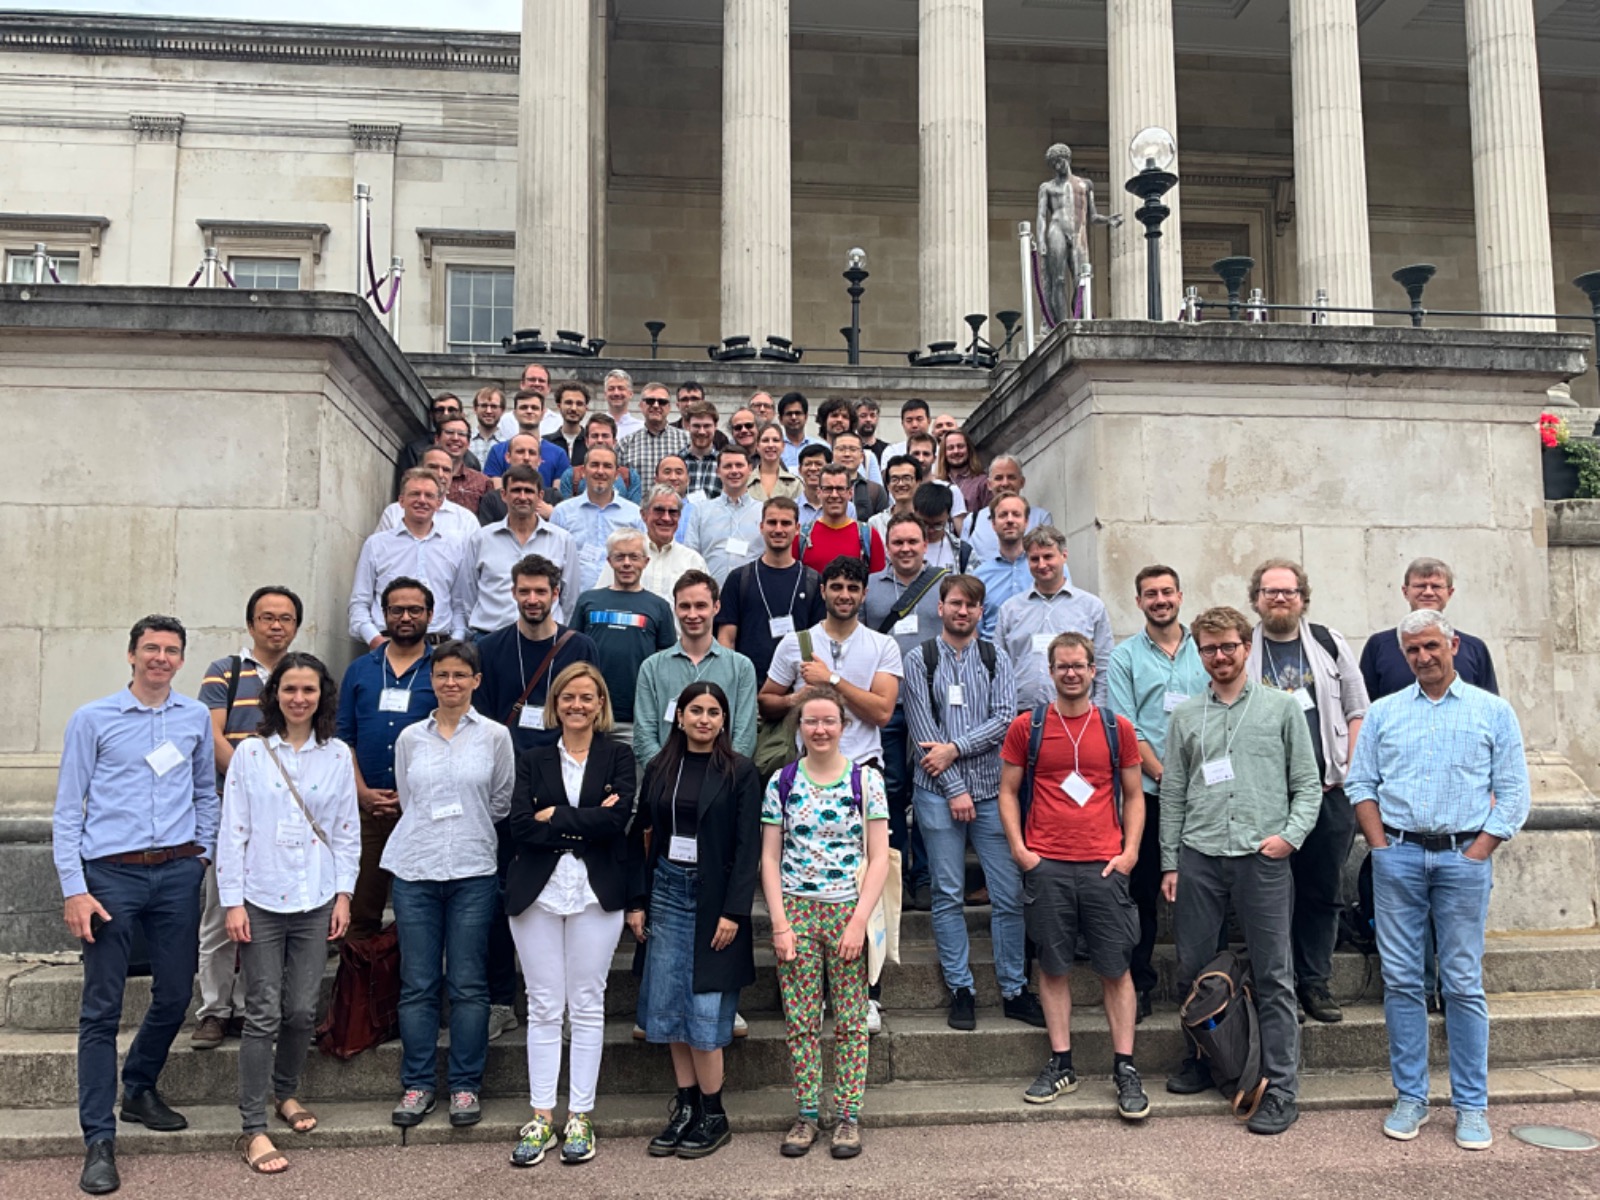
In July this year UCL hosted the CATMIN III: Frontiers in Rydberg Physics conference, co-organised by groups from Innsbruck, Harvard and UCL. Topics included Rydberg atom qubits for quantum computers [1], precision measurements of QED and fundamental constants [2], Rydberg molecule studies [3] and field sensing [4]. Our whole group attended, including our undergraduate summer students Yizhen and Carolina.

The group photo of CATMIN III in front of the UCL portico

David gave a broad presentation on Positronium Rydberg physics, including studies performed at UCL, most of which can be found on our publications page and a full video of the talk can be found on YouTube. Sam and I presented posters on ongoing work, both of which can be found in the downloads section. Sam is using Rydberg helium (He) to probe fields inside a microwave waveguide recently used to perform precision studies on the Ps n = 2 fine structure in which significant energy level shifts have been observed [5]. Given the sensitivity of Rydberg He to radio frequency, electric and magnetic fields and much better statistics compared to Ps we can investigate imperfections in the waveguide, a possible source of the shift found in Ps. A full blog post on this will be published soon.

My poster was on experiments done to observe THz (mm-wave) transitions in Rydberg Ps. For years the THz regime of the electromagnetic spectra (0.3 – 30 THz) was known as ‘the THz gap’, a band of EM radiation that is very hard to produce, lying between electronic methods at low photon energy and optical methods at high photon energy. However, much progress has been made in the last decade and there now exists commercially available technology (albeit for an extortionate price, a total of £90,000 for everything required) to generate radiation up to 1.7 THz. We are trying to measure the transition frequency between high n Rydberg states, in particular n = 21 – 24 which has a frequency of 0.874 THz. My poster described apparatus for this measurement but unfortunately, we have not yet seen any THz transition. We think the reason for this is that we have too little power (£90k only gets you 16 uW of THz power) or our statistics are too poor. Once this is working we can obtain a value for the Rydberg constant in a purely leptonic system which has advantages over the hadronic systems typically used (i.e. conventional atoms) [6]. This THz measurement can be done to examine systematics before an n = 2 – 21 measurement is performed for high precision result.

As well as the talks, we engaged in a different form of collaboration on Wednesday afternoon as there was a football match and a rounders game in Regents Park (we, of course, did very well… ish). After a somewhat achy Thursday there was a spectacular conference dinner at the Ambassador Hotel in Bloomsbury where the organiser of CATMIN IV gave a speech. We’d like to thank the organisers for hosting the event and allowing us to speak and look forward to CATMIN IV in Grenoble in the near future.

Sport!!
Rounders in Regents Park at CATMIN III

[1] Collectively Encoded Rydberg Qubit. N. L. R. Spong, Y. Jiao, O. D. W. Hughes, K. J. Weatherill, I. Lesanovsky, and C. S. Adams, Phys. Rev. Lett, 127, 063604 (2021)

[2] Precision millimetre-wave spectroscopy and calculation of the Stark manifolds in high Rydberg states of para-H2. N. Holsch, I. Doran, M. Beyer and F. Merkt, J. Mol. Spectroscopy, 387, 111648 (2022)

[3] Quantum-state-dependent decay rates of electrostatically trapped Rydberg NO molecules. M. H. Rayment and S. D. Hogan. Phys. Chem. Chem. Phys. 23 (34), 18806-18822 (2021)

[4] Rydberg-atom based radio-frequency electrometry using frequency modulation spectroscopy in room temperature vapor cells. S. Kumar, H. Fan, H. Kübler, A. J. Jahangiri, and J. P. Shaffer, Optics Express, 25(8), 8625-8637 (2017)

[5] Precision microwave spectroscopy of the positronium interval. R. E. Sheldon, T. J. Babij, S. H. Reeder, S. D. Hogan, and D. B. Cassidy, Phys. Rev. Lett. 131, 043001 (2023)

[6] Precision physics of simple atoms: QED tests, nuclear structure and fundamental constants. S. G. Karshenboim, Phys. Rep. 422, 1 (2005)

Microwaves & Positronium Pt. I: Lopsided Lorentzian Line shapes

A previous article of ours (found here) described how we measured the transition energy between two quantum states of Positronium (Ps). Measurements such as this allow us to test quantum mechanics, specifically the branch known as quantum electrodynamics (QED) which describes the electromagnetic force. If we perform a measurement that deviates from QED theory then the calculations, or the theory itself must be questioned. Deviations could come from so called ‘new physics’ such as new particles, new forces or even the source of dark matter [1,2]. However, more often than not it is an unknown feature of the experiment, as I will demonstrate here.

Figure 1. The triplet energy levels of the Ps n = 2 state and the associated fine structure transitions.

The previous measurement written about on this blog was of the 23P1 \rightarrow 23P0 transition, known as the \nu_0 interval, named after the subscript of the final state. These numbers and letters symbolise the values of different quantum numbers and therefore uniquely describe the energy state of the Ps atom. The image below explains what these numbers and letters represent.

Figure 2. An example of spectroscopic notation for Ps.

In addition to this transition we also measured two others, \nu_1 and \nu_2, see the published data here [3]. These showed something that the former did not. Figure 3 shows an example of the line shapes we measured, which are produced by creating Ps in the 23S1 energy state and then stimulating emission to the lower 23P1 or 23P2 energy state using microwave photons. The line shape represents how much of the initial state we transfer to the final state as a function of photon energy, given here in units of frequency in GHz. The closer the photons are to the exact transition frequency between the two states (i.e. their energy separation), the more atoms transfer from one state to another and the larger the signal we see. This central transition frequency is what QED predicts and what we want to measure. The key thing to note in these results is that these line shapes show an asymmetry, a bias to lower frequencies for the \nu_1 transition and higher frequencies for the \nu_2 transition, making the lineshapes look lopsided.

Figure 3. The asymmetric lineshapes measured during this work shown as the detuning from the theoretical resonant frequency, from Reference [3]. (a) The \nu_0 transition, (b) the \nu_1 transition and (c) the \nu_2 transition.

This is a problem. Line shapes of this kind are expected to conform to a specific shape described by an equation known as the Lorentzian function. This function is symmetric by definition, so if the line shape you are trying to extract data from is asymmetric then any transition frequency you obtain from a Lorentzian function fitted to the data is not trustworthy. The Lorentzian shape of this function is from QED theory. There is a possible source of asymmetry known as quantum interference (QI), whereby neighbouring states can cause a higher probability of excitation on the side of the measured line shape toward the neighbouring state. However, for these transitions the effect is much smaller than that observed and is beyond the current limit of our precision.

The question then is whether we can: (1) find a model (and corresponding equation) which correctly accounts for the asymmetric effects and get a meaningful value for the energy interval, or (2) identify the source of the asymmetry and try to remove it. During the experiments numerous tests were made which could not identify or remove the source of the asymmetry. Instead, we collaborated with Akopyan et al. who performed a large number of simulations, taking into account 28 states energy states with over 700 coupled differential equations, the results of which can be found here [4].

The conclusion was that the asymmetry was due to microwave radiation escaping from the ends of the waveguide used to confine it and being reflected back in from the walls of the vacuum chamber. This causes the strength of the microwaves to vary over the range of frequencies used to probe the Ps, causing some points to be artificially higher/lower and skewing our measurements.

Figure 4. The simulated variation in microwave field strength as a function of frequency and lineshapes calculated from the associated field strengths showing asymmetry and shifts from the expected transition frequency. (a) The \nu_0 transition, (b) the \nu_1 transition and (c) the \nu_2 transition. From Reference [4].

This effect can produce asymmetric lineshapes like those measured, but also introduce shifts to the transition frequency without asymmetry, casting doubt on the systematic error of the first \nu_0 measurement. Indeed, the transitions measured here are highly susceptible to this effect as they are much broader than those found in most microwave spectroscopy studies meaning these effects are less noticeable. In conclusion, reflection-induced frequency dependent power is a large systematic error in the data described in this and the previous article and some method must be determined to remove this. The next step is to investigate these effects experimentally to confirm how they behave, which will be explained in Pt. II of the story…

[1] Precision physics of simple atoms: QED tests, nuclear structure and fundamental constants. S. G. Karshenboim, Phys. Rep. 422, 1 (2005)

[2] Precision spectroscopy of positronium: Testing bound-state QED theory and the search for physics beyond the Standard Model. G. S. Adkins, D. B. Cassidy, J. Pérez-Ríos, Phys. Rep. 975, 1 (2022) DOI: 10.1016/j.physrep.2022.05.002

[3] Observation of asymmetric line shapes in precision microwave spectroscopy of the positronium 23P1 \rightarrow 23PJ (J = 1, 2) fine-structure intervals. L. Gurung, T. J. Babij, J. Pérez-Ríos, S. D. Hogan and D. B. Cassidy, Phys. Rev. A.103, 042805 (2021) DOI:10.1103/PhysRevA.103.042805

[4] Line-shape modelling in microwave spectroscopy of the positronium n = 2 fine-structure intervals. L. A. Akopyan, T. J. Babij, K. Lakhmanskiy, D. B. Cassidy and A. Matveev, Phys. Rev. A. 104, 062810 (2021) DOI: 10.1103/PhysRevA.104.062810